Estimated Value: $228,617 - $257,000
2
Beds
2
Baths
1,200
Sq Ft
$202/Sq Ft
Est. Value
About This Home
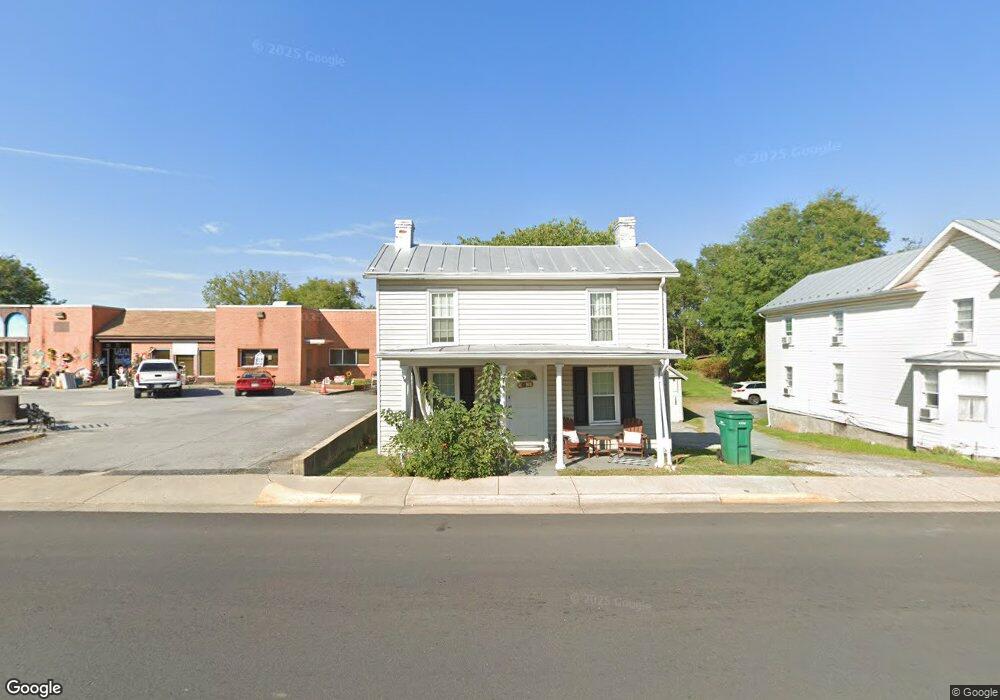
This home is located at 409 E Main St, Luray, VA 22835 and is currently estimated at $242,809, approximately $202 per square foot. 409 E Main St is a home located in Page County with nearby schools including Mt. Carmel Christian Academy.
Ownership History
Date
Name
Owned For
Owner Type
Purchase Details
Closed on
Sep 15, 2021
Sold by
Spl Rentals Llc
Bought by
Darcy Evan and Bradley Katherine L
Current Estimated Value
Home Financials for this Owner
Home Financials are based on the most recent Mortgage that was taken out on this home.
Original Mortgage
$161,910
Outstanding Balance
$147,544
Interest Rate
2.9%
Mortgage Type
Construction
Estimated Equity
$95,265
Purchase Details
Closed on
Aug 29, 2012
Purchase Details
Closed on
Feb 13, 2006
Create a Home Valuation Report for This Property
The Home Valuation Report is an in-depth analysis detailing your home's value as well as a comparison with similar homes in the area
Home Values in the Area
Average Home Value in this Area
Purchase History
| Date | Buyer | Sale Price | Title Company |
|---|---|---|---|
| Darcy Evan | $179,900 | -- | |
| -- | -- | -- | |
| -- | $107,000 | -- |
Source: Public Records
Mortgage History
| Date | Status | Borrower | Loan Amount |
|---|---|---|---|
| Open | Darcy Evan | $161,910 |
Source: Public Records
Tax History
| Year | Tax Paid | Tax Assessment Tax Assessment Total Assessment is a certain percentage of the fair market value that is determined by local assessors to be the total taxable value of land and additions on the property. | Land | Improvement |
|---|---|---|---|---|
| 2025 | $948 | $129,900 | $32,800 | $97,100 |
| 2024 | $948 | $129,900 | $32,800 | $97,100 |
| 2023 | $948 | $129,900 | $32,800 | $97,100 |
| 2022 | $948 | $129,900 | $32,800 | $97,100 |
| 2021 | $948 | $129,900 | $32,800 | $97,100 |
| 2020 | $825 | $113,000 | $32,800 | $80,200 |
| 2019 | $425 | $113,000 | $32,800 | $80,200 |
| 2018 | $791 | $113,000 | $32,800 | $80,200 |
| 2017 | $746 | $113,000 | $32,800 | $80,200 |
| 2016 | $746 | $113,000 | $32,800 | $80,200 |
| 2015 | $742 | $115,900 | $32,800 | $83,100 |
| 2014 | $730 | $114,100 | $32,800 | $81,300 |
Source: Public Records
Map
Nearby Homes
- 125 High St
- 11 Bristol Ave
- 26 O Flinn St
- 26 Oflinn St
- 115 E Page St
- 201 Woodland Ave
- 40 Cave St
- 183 Blue Bell Ave
- 2 Terrace Ln
- 0 Woodland Dr Unit VAPA2005678
- 0 Woodland Dr Unit 671790
- 411 Fourth St
- 0 Collins Ave Unit VAPA2003268
- 1012 E Main St
- 406 6th St
- 406 Sixth St
- 0 Seventh St
- 221 W Main St
- 220 Mechanic St
- 0 Cottage Dr
Your Personal Tour Guide
Ask me questions while you tour the home.