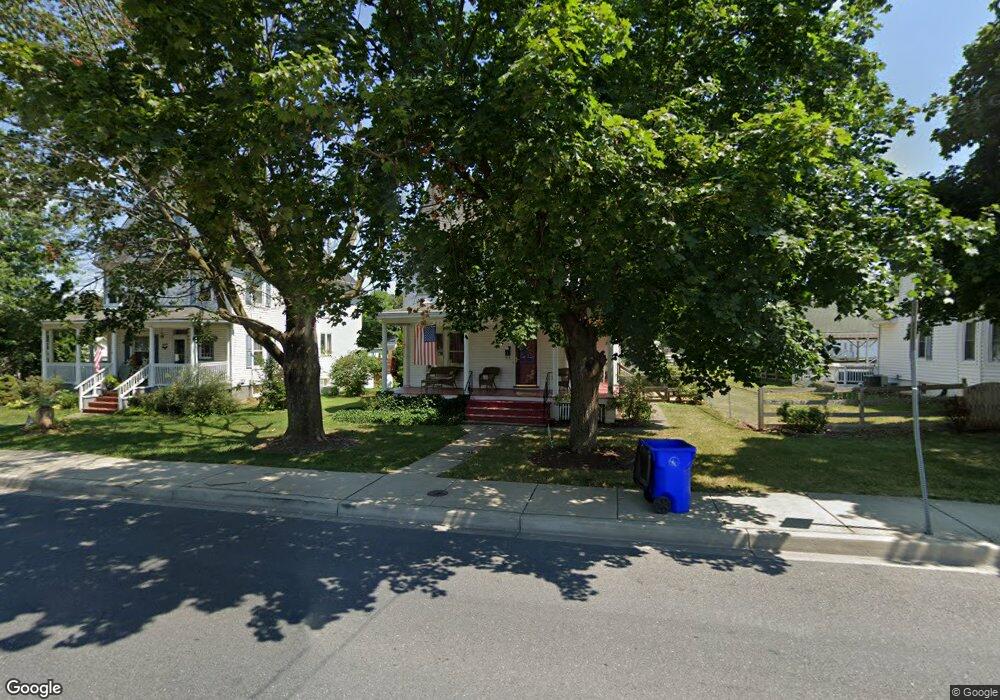
409 E Main St Thurmont, MD 21788
Estimated Value: $279,135 - $293,000
3
Beds
2
Baths
1,452
Sq Ft
$198/Sq Ft
Est. Value
About This Home
This home is located at 409 E Main St, Thurmont, MD 21788 and is currently estimated at $286,784, approximately $197 per square foot. 409 E Main St is a home located in Frederick County with nearby schools including Thurmont Primary School, Thurmont Elementary School, and Thurmont Middle School.
Ownership History
Date
Name
Owned For
Owner Type
Purchase Details
Closed on
Jun 27, 2011
Sold by
Gregory James E
Bought by
Betz Jeffrey A and Betz Christine G
Current Estimated Value
Home Financials for this Owner
Home Financials are based on the most recent Mortgage that was taken out on this home.
Original Mortgage
$123,869
Outstanding Balance
$85,499
Interest Rate
4.58%
Mortgage Type
New Conventional
Estimated Equity
$201,285
Purchase Details
Closed on
Mar 28, 2003
Sold by
Johnson Richard W and Johnson Joan M
Bought by
Gregory James E & Revocable Trust
Purchase Details
Closed on
Jun 16, 1982
Sold by
Fisher Cora M
Bought by
Johnson Richard W and Johnson Joan M
Home Financials for this Owner
Home Financials are based on the most recent Mortgage that was taken out on this home.
Original Mortgage
$36,000
Interest Rate
16.7%
Create a Home Valuation Report for This Property
The Home Valuation Report is an in-depth analysis detailing your home's value as well as a comparison with similar homes in the area
Home Values in the Area
Average Home Value in this Area
Purchase History
| Date | Buyer | Sale Price | Title Company |
|---|---|---|---|
| Betz Jeffrey A | $135,000 | -- | |
| Betz Jeffrey A | $135,000 | -- | |
| Betz Jeffrey A | $135,000 | None Available | |
| Gregory James E & Revocable Trust | $180,000 | -- | |
| Johnson Richard W | $52,000 | -- |
Source: Public Records
Mortgage History
| Date | Status | Borrower | Loan Amount |
|---|---|---|---|
| Open | Betz Jeffrey A | $123,869 | |
| Previous Owner | Johnson Richard W | $36,000 |
Source: Public Records
Tax History
| Year | Tax Paid | Tax Assessment Tax Assessment Total Assessment is a certain percentage of the fair market value that is determined by local assessors to be the total taxable value of land and additions on the property. | Land | Improvement |
|---|---|---|---|---|
| 2025 | $2,694 | $209,500 | -- | -- |
| 2024 | $2,694 | $187,000 | $0 | $0 |
| 2023 | $2,515 | $164,500 | $56,500 | $108,000 |
| 2022 | $2,454 | $160,333 | $0 | $0 |
| 2021 | $2,299 | $156,167 | $0 | $0 |
| 2020 | $2,299 | $152,000 | $56,500 | $95,500 |
| 2019 | $2,276 | $150,433 | $0 | $0 |
| 2018 | $2,285 | $148,867 | $0 | $0 |
| 2017 | $2,210 | $147,300 | $0 | $0 |
| 2016 | $3,001 | $143,867 | $0 | $0 |
| 2015 | $3,001 | $140,433 | $0 | $0 |
| 2014 | $3,001 | $137,000 | $0 | $0 |
Source: Public Records
Map
Nearby Homes
- 33 Walnut St
- 19 N Carroll St
- 10 Radio Ln
- 706 E Main St
- 18 Water St
- 112 Ironmaster Dr
- 125 Cody Dr Unit 34
- 5 Spangler Ct
- 7 Westview Ct
- 103 E Hammaker St
- 304 Apples Church Rd
- 17 Colliery Dr
- 105 Colliery Dr
- 5 Old Barn Ct
- 6 Sylvia Cir
- 58 Mountaintop Rd
- 59 Mountaintop Rd
- 8128 Apples Church Rd
- 13620 Pryor Rd
- 13403 Catoctin Furnace Rd
Your Personal Tour Guide
Ask me questions while you tour the home.