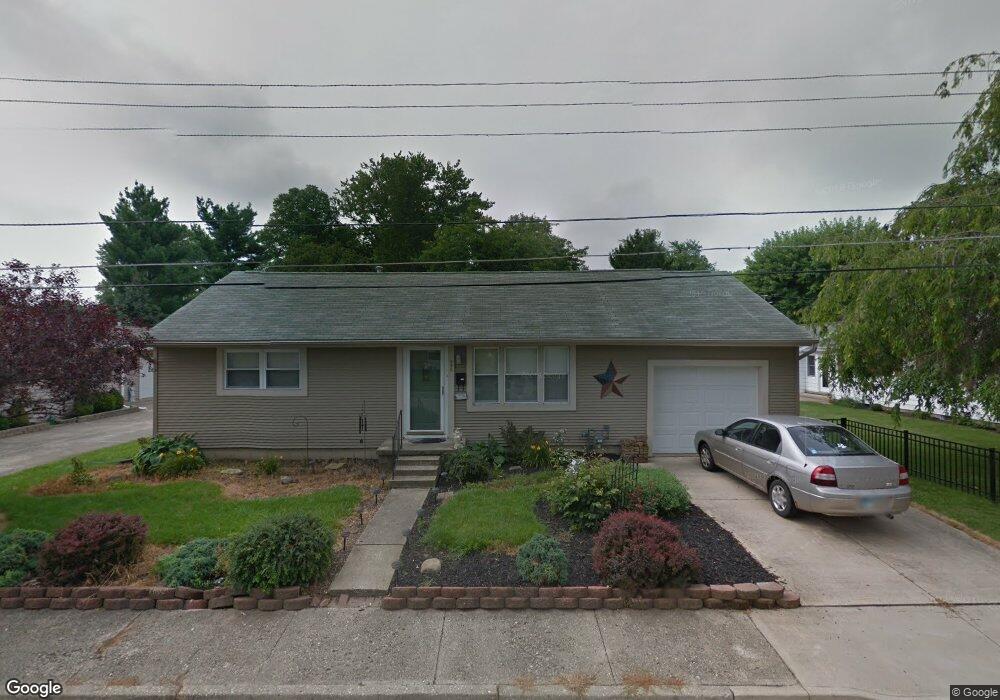
409 E Maple St Covington, OH 45318
Estimated Value: $156,090 - $169,000
3
Beds
1
Bath
864
Sq Ft
$186/Sq Ft
Est. Value
About This Home
This home is located at 409 E Maple St, Covington, OH 45318 and is currently estimated at $160,773, approximately $186 per square foot. 409 E Maple St is a home located in Miami County with nearby schools including Covington Elementary/Junior High School, Covington Junior High School, and Covington High School.
Ownership History
Date
Name
Owned For
Owner Type
Purchase Details
Closed on
Jul 24, 2023
Sold by
Clason Debra
Bought by
Clason Debra
Current Estimated Value
Purchase Details
Closed on
Dec 1, 2006
Sold by
Laughman Barbara L
Bought by
Clark Pauline E
Purchase Details
Closed on
Feb 4, 2003
Sold by
Laughman John D and Laughman Barbara L
Bought by
Knasel Leroy A and Knasel June O
Purchase Details
Closed on
Sep 19, 2002
Sold by
King Robert L and King Merri L
Bought by
Laughman John D and Laughman Barbara L
Purchase Details
Closed on
Jan 1, 1978
Bought by
Snider Jack B
Create a Home Valuation Report for This Property
The Home Valuation Report is an in-depth analysis detailing your home's value as well as a comparison with similar homes in the area
Home Values in the Area
Average Home Value in this Area
Purchase History
| Date | Buyer | Sale Price | Title Company |
|---|---|---|---|
| Clason Debra | $120,000 | None Listed On Document | |
| Clark Pauline E | $45,750 | -- | |
| Knasel Leroy A | $92,000 | -- | |
| Laughman John D | $81,000 | -- | |
| Snider Jack B | -- | -- |
Source: Public Records
Mortgage History
| Date | Status | Borrower | Loan Amount |
|---|---|---|---|
| Closed | Laughman John D | $0 |
Source: Public Records
Tax History
| Year | Tax Paid | Tax Assessment Tax Assessment Total Assessment is a certain percentage of the fair market value that is determined by local assessors to be the total taxable value of land and additions on the property. | Land | Improvement |
|---|---|---|---|---|
| 2024 | $1,873 | $43,960 | $10,430 | $33,530 |
| 2023 | $1,684 | $43,960 | $10,430 | $33,530 |
| 2022 | $1,322 | $43,960 | $10,430 | $33,530 |
| 2021 | $1,019 | $33,820 | $8,020 | $25,800 |
| 2020 | $1,021 | $33,820 | $8,020 | $25,800 |
| 2019 | $1,026 | $33,820 | $8,020 | $25,800 |
| 2018 | $818 | $28,640 | $6,270 | $22,370 |
| 2017 | $833 | $28,640 | $6,270 | $22,370 |
| 2016 | $823 | $28,640 | $6,270 | $22,370 |
| 2015 | $745 | $27,510 | $6,020 | $21,490 |
| 2014 | $745 | $27,510 | $6,020 | $21,490 |
| 2013 | $717 | $27,510 | $6,020 | $21,490 |
Source: Public Records
Map
Nearby Homes
- 413 E Maple St
- 40 N Wenrick St
- 36 N Wenrick St
- 412 E Maple St
- 102 N Wenrick St
- 108 N Wenrick St
- 24 N Wenrick St
- 39 N Wenrick St
- 37 N Wenrick St
- 101 N Wenrick St
- 107 N Wenrick St
- 27 N Wenrick St
- 22 N Wenrick St
- 111 N Wenrick St
- 114 N Wenrick St
- 94 N Ludlow St
- 96 N Ludlow St
- 17 N Wenrick St
- 38 N Ludlow St
- 102 N Ludlow St
Your Personal Tour Guide
Ask me questions while you tour the home.