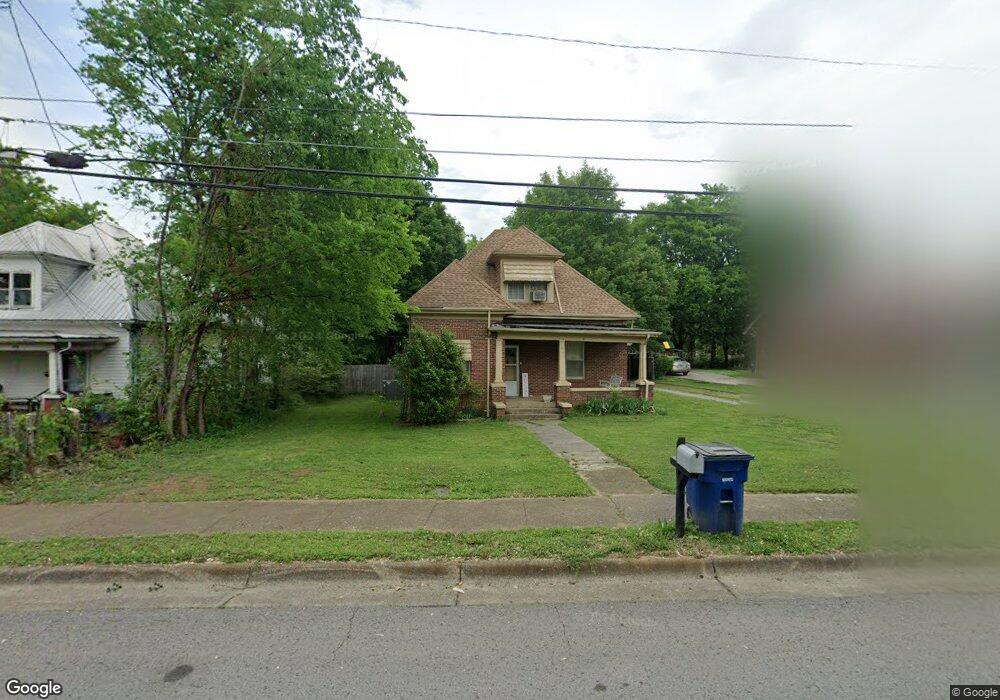
409 Elliott St Shelbyville, TN 37160
Estimated Value: $169,000 - $286,000
--
Bed
2
Baths
2,048
Sq Ft
$112/Sq Ft
Est. Value
About This Home
This home is located at 409 Elliott St, Shelbyville, TN 37160 and is currently estimated at $230,012, approximately $112 per square foot. 409 Elliott St is a home located in Bedford County with nearby schools including East Side Elementary School, Harris Middle School, and Christian Chapel Academy.
Ownership History
Date
Name
Owned For
Owner Type
Purchase Details
Closed on
Aug 3, 2021
Sold by
Mendez Martha G and Parker Debra R
Bought by
Bowling James P and Mckenzie Sharyl L
Current Estimated Value
Home Financials for this Owner
Home Financials are based on the most recent Mortgage that was taken out on this home.
Original Mortgage
$187,878
Outstanding Balance
$170,548
Interest Rate
2.93%
Mortgage Type
New Conventional
Estimated Equity
$59,464
Purchase Details
Closed on
May 29, 2002
Sold by
Khachtooriann Al
Bought by
Smotherman Thomas C
Home Financials for this Owner
Home Financials are based on the most recent Mortgage that was taken out on this home.
Original Mortgage
$30,000
Interest Rate
6.77%
Purchase Details
Closed on
Nov 14, 1992
Bought by
Soloman Billy A and Soloman Sheryll W
Purchase Details
Closed on
Nov 13, 1992
Bought by
Raulerson Karen C
Purchase Details
Closed on
Nov 6, 1992
Bought by
Raulerson W Owen
Purchase Details
Closed on
Nov 12, 1991
Bought by
Chemical Mort Co
Purchase Details
Closed on
Nov 8, 1991
Purchase Details
Closed on
Dec 5, 1989
Bought by
Bowling Paul and Bowling Cyndi
Purchase Details
Closed on
Jun 30, 1988
Bought by
Chambers Robert A
Create a Home Valuation Report for This Property
The Home Valuation Report is an in-depth analysis detailing your home's value as well as a comparison with similar homes in the area
Home Values in the Area
Average Home Value in this Area
Purchase History
| Date | Buyer | Sale Price | Title Company |
|---|---|---|---|
| Bowling James P | $180,000 | None Available | |
| Smotherman Thomas C | $52,500 | -- | |
| Soloman Billy A | $33,000 | -- | |
| Raulerson Karen C | -- | -- | |
| Raulerson W Owen | -- | -- | |
| Chemical Mort Co | -- | -- | |
| -- | -- | -- | |
| Bowling Paul | -- | -- | |
| Chambers Robert A | -- | -- |
Source: Public Records
Mortgage History
| Date | Status | Borrower | Loan Amount |
|---|---|---|---|
| Open | Bowling James P | $187,878 | |
| Previous Owner | Chambers Robert A | $30,000 |
Source: Public Records
Tax History Compared to Growth
Tax History
| Year | Tax Paid | Tax Assessment Tax Assessment Total Assessment is a certain percentage of the fair market value that is determined by local assessors to be the total taxable value of land and additions on the property. | Land | Improvement |
|---|---|---|---|---|
| 2025 | -- | $43,300 | $0 | $0 |
| 2024 | -- | $43,300 | $6,675 | $36,625 |
| 2023 | $1,648 | $43,300 | $6,675 | $36,625 |
| 2022 | $1,695 | $43,300 | $6,675 | $36,625 |
| 2021 | $1,539 | $43,300 | $6,675 | $36,625 |
| 2020 | $1,019 | $43,300 | $6,675 | $36,625 |
| 2019 | $1,019 | $23,000 | $3,500 | $19,500 |
| 2018 | $996 | $23,000 | $3,500 | $19,500 |
| 2017 | $996 | $23,000 | $3,500 | $19,500 |
| 2016 | $987 | $23,000 | $3,500 | $19,500 |
| 2015 | $987 | $23,000 | $3,500 | $19,500 |
| 2014 | $945 | $24,101 | $0 | $0 |
Source: Public Records
Map
Nearby Homes
- 220 Walnut St
- 0 E Depot St
- 709 Belmont Ave
- 120 Dogwood Ct
- 112 Elizabeth St
- 527 Deery St
- 464 Whitthorne St
- 207 Martha St
- 222 Carter St
- 102 Germantown Rd
- 211 S Fairoak St
- 418 Riverview Dr
- 627 E Lane St
- 631 E Lane St
- 713 King Ave
- 215 Coney Island Rd
- 714 King Ave
- 314 Maplewood Dr
- 724 Alton Ave
- 636 Deery St
- 405 Elliott St
- 411 Elliott St
- 415 Elliott St
- 401 Elliott St
- 417 Elliott St
- 216 Walnut St
- 419 Elliott St
- 212 Walnut St
- 210 Walnut St
- 211 Walnut St
- 422 Belmont Ave
- 209 Walnut St
- 410 Belmont Ave
- 404 Belmont Ave
- 207 Walnut St #B
- 207 Walnut St
- 207 Walnut St Unit B
- 402 Belmont Ave
- 416 Belmont Ave
- 502 Belmont Ave