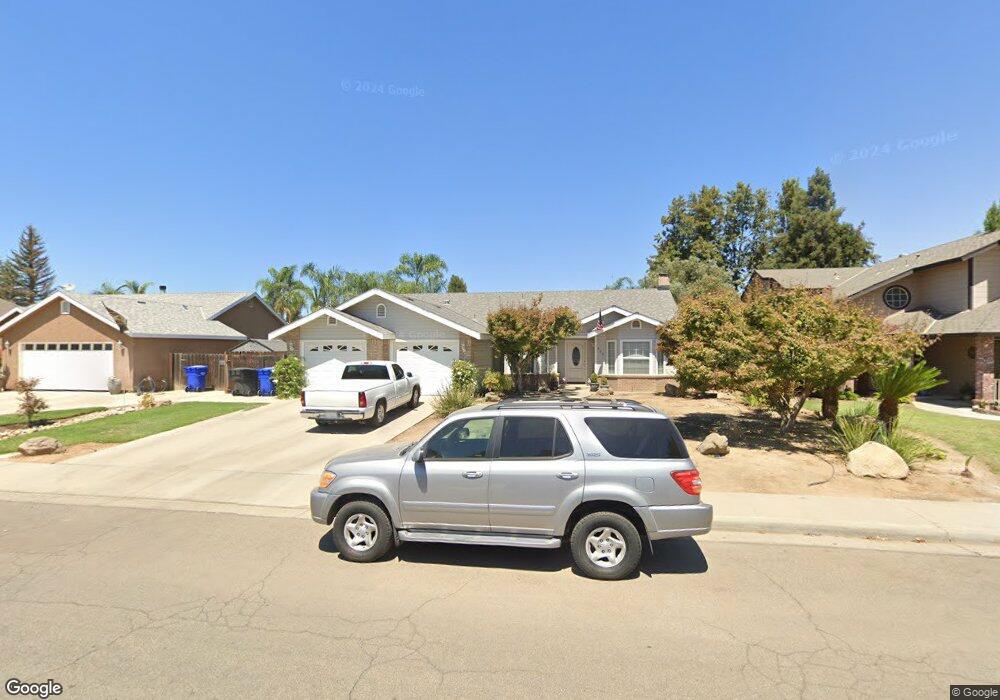
409 Euclid Cir Dinuba, CA 93618
Estimated Value: $427,000 - $507,000
3
Beds
2
Baths
2,112
Sq Ft
$213/Sq Ft
Est. Value
About This Home
This home is located at 409 Euclid Cir, Dinuba, CA 93618 and is currently estimated at $450,719, approximately $213 per square foot. 409 Euclid Cir is a home located in Tulare County with nearby schools including Roosevelt Elementary School, Washington Intermediate School, and Dinuba High School.
Ownership History
Date
Name
Owned For
Owner Type
Purchase Details
Closed on
May 2, 2023
Sold by
Hayes Richard A and Hayes Christina M
Bought by
Richard A Hayes And Christina M Hayes 2022 Re
Current Estimated Value
Purchase Details
Closed on
Apr 5, 2023
Sold by
Hayes Richard A and Hayes Christina M
Bought by
Richard A Hayes And Christina M Hayes 2022 Re and Hayes
Purchase Details
Closed on
Jan 24, 2001
Sold by
Heinrichs Marvin L and Heinrichs Alma S
Bought by
Hayes Richard A and Hayes Christina M
Purchase Details
Closed on
Aug 21, 1997
Sold by
Willems Bob and Willems Lucille
Bought by
Hayes Richard A and Hayes Christina M
Purchase Details
Closed on
Jul 30, 1996
Sold by
Odiorne Bessie M
Bought by
Hayes Richard A and Hayes Christina M
Purchase Details
Closed on
Mar 14, 1995
Sold by
Odiorne Bessie M
Bought by
Hayes Richard A and Hayes Christina M
Create a Home Valuation Report for This Property
The Home Valuation Report is an in-depth analysis detailing your home's value as well as a comparison with similar homes in the area
Home Values in the Area
Average Home Value in this Area
Purchase History
| Date | Buyer | Sale Price | Title Company |
|---|---|---|---|
| Richard A Hayes And Christina M Hayes 2022 Re | -- | None Listed On Document | |
| Richard A Hayes And Christina M Hayes 2022 Re | -- | None Listed On Document | |
| Hayes Richard A | $43,000 | Chicago Title Co | |
| Hayes Richard A | $29,000 | Chicago Title Co | |
| Hayes Richard A | $16,000 | Chicago Title Co | |
| Hayes Richard A | $19,000 | Chicago Title Company |
Source: Public Records
Tax History Compared to Growth
Tax History
| Year | Tax Paid | Tax Assessment Tax Assessment Total Assessment is a certain percentage of the fair market value that is determined by local assessors to be the total taxable value of land and additions on the property. | Land | Improvement |
|---|---|---|---|---|
| 2025 | $2,784 | $253,165 | $47,744 | $205,421 |
| 2024 | $2,784 | $248,202 | $46,808 | $201,394 |
| 2023 | $2,752 | $243,337 | $45,891 | $197,446 |
| 2022 | $2,628 | $238,567 | $44,992 | $193,575 |
| 2021 | $2,563 | $233,889 | $44,110 | $189,779 |
| 2020 | $2,607 | $231,491 | $43,658 | $187,833 |
| 2019 | $2,637 | $226,952 | $42,802 | $184,150 |
| 2018 | $2,555 | $222,502 | $41,963 | $180,539 |
| 2017 | $2,537 | $218,139 | $41,140 | $176,999 |
| 2016 | $2,419 | $213,861 | $40,333 | $173,528 |
| 2015 | $2,047 | $209,000 | $52,000 | $157,000 |
| 2014 | $2,047 | $181,000 | $45,000 | $136,000 |
Source: Public Records
Map
Nearby Homes
- 1177 Timothy Ave
- 1401 N Nichols Ave
- 1306 Country Place
- 371 Village Dr
- 1237 Chestnut Ln
- 976 Daisy Ct
- 375 Amber Ln
- 397 Amber Ln
- 605 E Davis Dr
- 616 W Bloomingdale Ave
- 7301 Avenue 424
- 784/784a N Lillie Ave
- 1007 Ruby Ln Unit Lt 53
- 789 E Millwood Dr
- 1513 Crimson Way Unit Lot 4
- 1484 Concord Way Unit Lt 37
- 1484 Concord Way Unit Lot 37
- 785 E Saginaw Ave
- 1266 N Skye St Unit Mb90
- 0 E Sequoia Dr
- 435 Euclid Cir
- 387 Euclid Cir
- 461 Euclid Cir
- 365 Euclid Cir
- 1642 N Euclid Ave
- 487 Euclid Cir
- 343 Euclid Cir
- 404 Euclid Cir
- 404 W Nebraska Ave
- 430 Euclid Cir
- 382 Euclid Cir
- 1656 N Euclid Ave
- 420 W Nebraska Ave
- 452 Euclid Cir
- 360 Euclid Cir
- 474 Euclid Cir
- 321 Euclid Cir
- 338 Euclid Cir
- 316 Euclid Cir
- 1659 N Euclid Ave