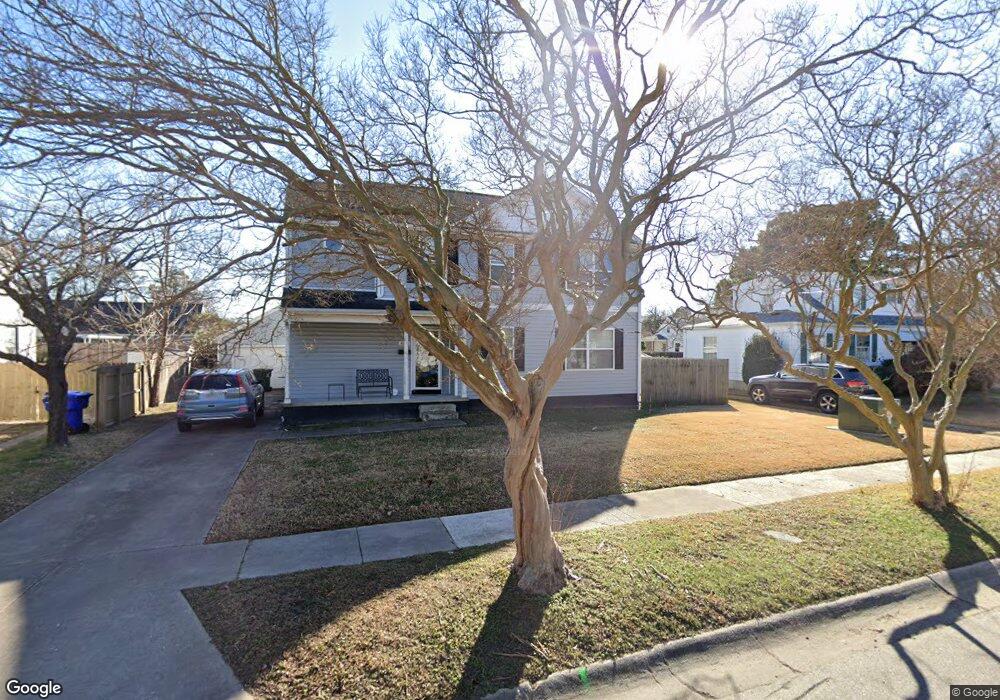
409 Farrell St Norfolk, VA 23503
Northside NeighborhoodEstimated Value: $405,311 - $460,000
4
Beds
3
Baths
2,169
Sq Ft
$197/Sq Ft
Est. Value
About This Home
This home is located at 409 Farrell St, Norfolk, VA 23503 and is currently estimated at $428,328, approximately $197 per square foot. 409 Farrell St is a home located in Norfolk City with nearby schools including Mary Calcott Elementary School, Northside Middle School, and Granby High School.
Ownership History
Date
Name
Owned For
Owner Type
Purchase Details
Closed on
Oct 7, 2016
Sold by
Dye Jultssa O and Dye Ronald L
Bought by
Dye Julitssa O
Current Estimated Value
Home Financials for this Owner
Home Financials are based on the most recent Mortgage that was taken out on this home.
Original Mortgage
$268,516
Outstanding Balance
$215,129
Interest Rate
3.44%
Mortgage Type
New Conventional
Estimated Equity
$213,199
Purchase Details
Closed on
Nov 17, 2015
Sold by
Equity Development Corporation Inc
Bought by
Dye Julitssa O and Dye Ronald L
Home Financials for this Owner
Home Financials are based on the most recent Mortgage that was taken out on this home.
Original Mortgage
$264,900
Interest Rate
3.83%
Mortgage Type
VA
Purchase Details
Closed on
May 28, 2015
Sold by
Ane Investments Llc A Virginia Limited L
Bought by
Equity Development Corporation Inc
Home Financials for this Owner
Home Financials are based on the most recent Mortgage that was taken out on this home.
Original Mortgage
$165,379
Interest Rate
3.65%
Mortgage Type
Credit Line Revolving
Purchase Details
Closed on
Jan 23, 2015
Sold by
Vrattos Peter A
Bought by
Ane Investments Llc
Home Financials for this Owner
Home Financials are based on the most recent Mortgage that was taken out on this home.
Original Mortgage
$25,000
Interest Rate
3.96%
Mortgage Type
Purchase Money Mortgage
Create a Home Valuation Report for This Property
The Home Valuation Report is an in-depth analysis detailing your home's value as well as a comparison with similar homes in the area
Home Values in the Area
Average Home Value in this Area
Purchase History
| Date | Buyer | Sale Price | Title Company |
|---|---|---|---|
| Dye Julitssa O | -- | None Available | |
| Dye Julitssa O | $264,900 | Priority Title & Escrow | |
| Equity Development Corporation Inc | $76,000 | Stewart Title | |
| Ane Investments Llc | $36,500 | None Available |
Source: Public Records
Mortgage History
| Date | Status | Borrower | Loan Amount |
|---|---|---|---|
| Open | Dye Julitssa O | $268,516 | |
| Closed | Dye Julitssa O | $264,900 | |
| Previous Owner | Equity Development Corporation Inc | $165,379 | |
| Previous Owner | Ane Investments Llc | $25,000 |
Source: Public Records
Tax History Compared to Growth
Tax History
| Year | Tax Paid | Tax Assessment Tax Assessment Total Assessment is a certain percentage of the fair market value that is determined by local assessors to be the total taxable value of land and additions on the property. | Land | Improvement |
|---|---|---|---|---|
| 2025 | $4,731 | $378,500 | $78,500 | $300,000 |
| 2024 | $4,493 | $365,300 | $78,500 | $286,800 |
| 2023 | $4,390 | $351,200 | $78,500 | $272,700 |
| 2022 | $4,254 | $340,300 | $69,900 | $270,400 |
| 2021 | $3,929 | $314,300 | $63,500 | $250,800 |
| 2020 | $3,716 | $297,300 | $55,000 | $242,300 |
| 2019 | $3,654 | $292,300 | $50,000 | $242,300 |
| 2018 | $3,301 | $264,100 | $50,000 | $214,100 |
| 2017 | $2,970 | $258,300 | $50,000 | $208,300 |
| 2016 | $2,970 | $119,700 | $50,000 | $69,700 |
| 2015 | $1,377 | $119,700 | $50,000 | $69,700 |
| 2014 | $1,377 | $119,700 | $50,000 | $69,700 |
Source: Public Records
Map
Nearby Homes
- 408 E Westmont Ave
- 418 E Westmont Ave
- 409 E Westmont Ave
- 227 Farrell St
- 423 Fresh Meadow Rd
- 214 E Chester St
- 8832 Stratford St
- 314 E Evans St
- 421 E Randall Ave
- 618 Beach View St
- 604 Earl St
- 8909 Stratford St
- 405 E Lorengo Ave
- 311 Neoma Dr
- 215 E Evans St
- 322 Richardson St
- 263 E Bayview Blvd
- 8723 Chesapeake Blvd
- 138 E Leicester Ave
- 9014 Chesapeake Blvd