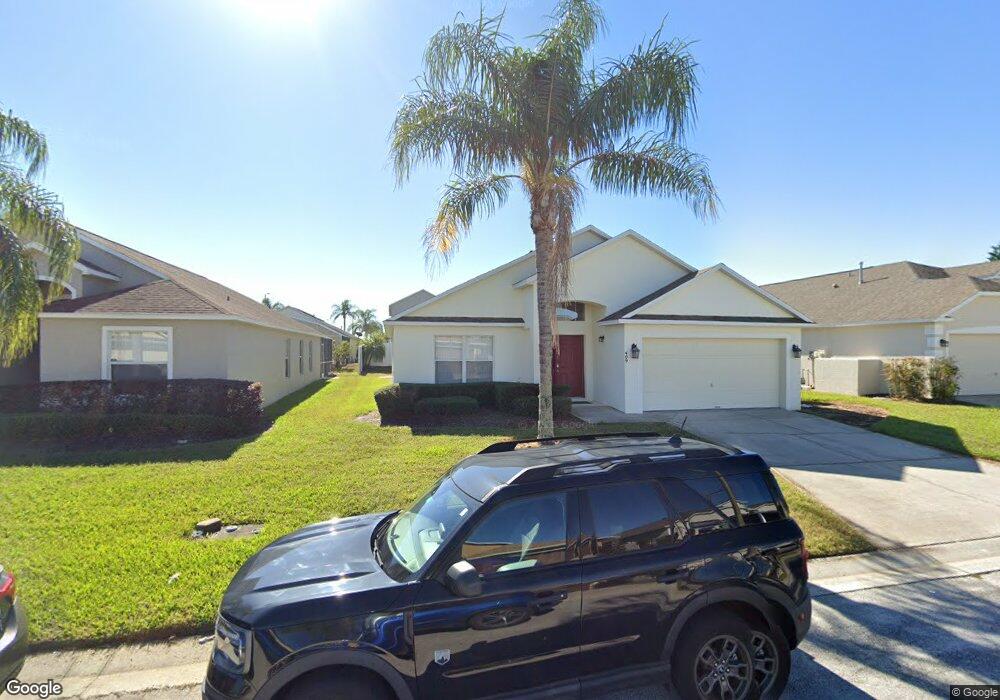
409 Fox Loop Davenport, FL 33837
Estimated Value: $333,859 - $375,000
3
Beds
2
Baths
2,264
Sq Ft
$154/Sq Ft
Est. Value
About This Home
This home is located at 409 Fox Loop, Davenport, FL 33837 and is currently estimated at $347,715, approximately $153 per square foot. 409 Fox Loop is a home located in Polk County with nearby schools including Davenport School Of The Arts, Citrus Ridge Academy: a Civics Academy, and Dundee Elementary Academy.
Ownership History
Date
Name
Owned For
Owner Type
Purchase Details
Closed on
Nov 7, 2018
Sold by
2018 4 Ih Borrower Lp
Bought by
Srp Sub Llc
Current Estimated Value
Purchase Details
Closed on
Jun 1, 2016
Bought by
Csh 2016 1 Borrower Llc
Purchase Details
Closed on
Mar 5, 2013
Sold by
Wilson Jones Carlton
Bought by
Colfin Ai-Fl 2 Llc
Purchase Details
Closed on
May 17, 2004
Sold by
Polyak Homes Inc
Bought by
Wilson Jones Carlton and Wilson Jones Ruth
Home Financials for this Owner
Home Financials are based on the most recent Mortgage that was taken out on this home.
Original Mortgage
$166,000
Interest Rate
5.37%
Mortgage Type
Purchase Money Mortgage
Create a Home Valuation Report for This Property
The Home Valuation Report is an in-depth analysis detailing your home's value as well as a comparison with similar homes in the area
Home Values in the Area
Average Home Value in this Area
Purchase History
| Date | Buyer | Sale Price | Title Company |
|---|---|---|---|
| Srp Sub Llc | -- | Os National Llc | |
| Csh 2016 1 Borrower Llc | $100 | -- | |
| Colfin Ai-Fl 2 Llc | $144,400 | Attorney | |
| Wilson Jones Carlton | $221,400 | Stewart Title Of Four Corner |
Source: Public Records
Mortgage History
| Date | Status | Borrower | Loan Amount |
|---|---|---|---|
| Previous Owner | Wilson Jones Carlton | $166,000 |
Source: Public Records
Tax History
| Year | Tax Paid | Tax Assessment Tax Assessment Total Assessment is a certain percentage of the fair market value that is determined by local assessors to be the total taxable value of land and additions on the property. | Land | Improvement |
|---|---|---|---|---|
| 2025 | $4,287 | $284,842 | $50,000 | $234,842 |
| 2024 | $4,055 | $267,771 | -- | -- |
| 2023 | $4,055 | $243,428 | $0 | $0 |
| 2022 | $3,740 | $221,298 | $0 | $0 |
| 2021 | $3,291 | $201,180 | $36,000 | $165,180 |
| 2020 | $3,207 | $195,014 | $34,000 | $161,014 |
| 2018 | $2,857 | $165,451 | $32,000 | $133,451 |
| 2017 | $2,711 | $157,463 | $0 | $0 |
| 2016 | $2,715 | $154,660 | $0 | $0 |
Source: Public Records
Map
Nearby Homes
- 316 Tivoli Cir
- 459 Tivoli Cir
- 964 Knollwood Dr
- 1138 Knollwood Dr
- 339 Sigmund Loop
- 1354 Knollwood Dr
- 5520 Meadow Walk Dr
- 238 Sunset View Dr
- 246 Queen Mary Dr
- 5480 Meadow Walk Dr
- 5491 Meadow Walk Dr
- 635 Knollwood Dr
- 4470 River Beacon Blvd
- 4612 River Beacon Blvd
- 348 Sir Phillips Dr
- 5467 Meadow Walk Dr
- 5452 Meadow Walk Dr
- 5459 Meadow Walk Dr
- 213 Knollwood Dr
- 5455 Meadow Walk Dr
Your Personal Tour Guide
Ask me questions while you tour the home.