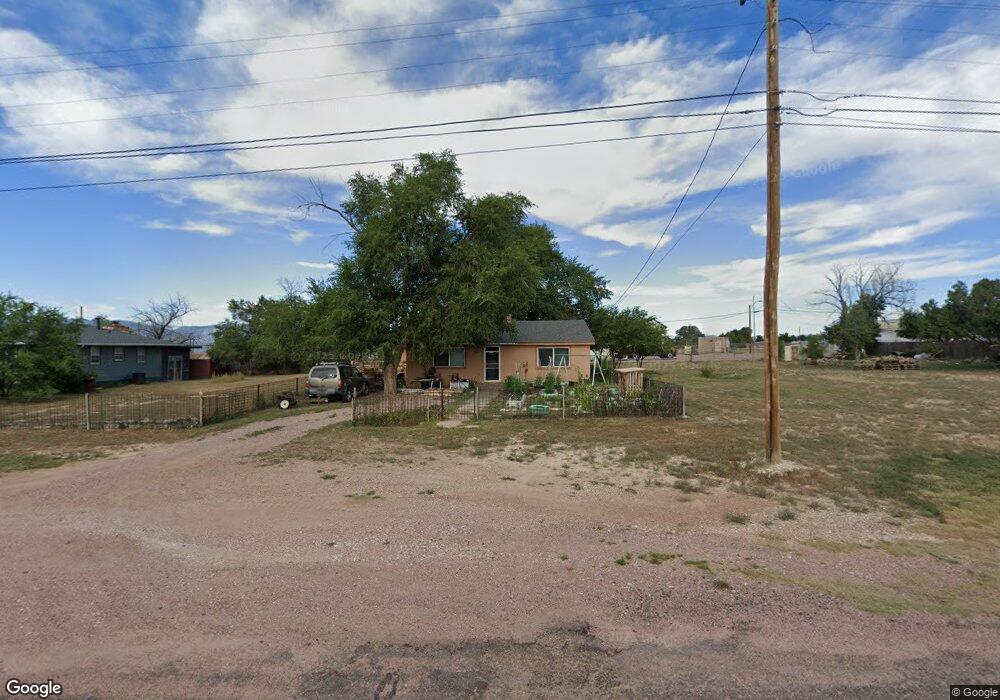
409 Fremont St Penrose, CO 81240
Estimated Value: $164,000 - $216,000
2
Beds
1
Bath
825
Sq Ft
$232/Sq Ft
Est. Value
About This Home
This home is located at 409 Fremont St, Penrose, CO 81240 and is currently estimated at $191,462, approximately $232 per square foot. 409 Fremont St is a home located in Fremont County with nearby schools including Penrose Elementary School and Florence High School.
Ownership History
Date
Name
Owned For
Owner Type
Purchase Details
Closed on
Jun 12, 2009
Sold by
Tolbert Celia J
Bought by
Sanders Laura J
Current Estimated Value
Home Financials for this Owner
Home Financials are based on the most recent Mortgage that was taken out on this home.
Original Mortgage
$81,090
Outstanding Balance
$51,040
Interest Rate
4.7%
Mortgage Type
New Conventional
Estimated Equity
$140,422
Purchase Details
Closed on
Feb 8, 2008
Sold by
Livingston Joe B and Livingston Linda L
Bought by
Tolbert Cella J
Purchase Details
Closed on
Feb 6, 2008
Sold by
Hsbc Bank Usa
Bought by
Livingston Joe B and Livingston Linda L
Purchase Details
Closed on
Dec 28, 2007
Sold by
Gutierrez Anthony
Bought by
Hsbc Bank Usa
Purchase Details
Closed on
Apr 18, 2005
Sold by
Gonzales Nancy H and Gonzales Nancy H
Bought by
Gutierrez Anthony
Home Financials for this Owner
Home Financials are based on the most recent Mortgage that was taken out on this home.
Original Mortgage
$60,000
Interest Rate
9.25%
Mortgage Type
Adjustable Rate Mortgage/ARM
Create a Home Valuation Report for This Property
The Home Valuation Report is an in-depth analysis detailing your home's value as well as a comparison with similar homes in the area
Home Values in the Area
Average Home Value in this Area
Purchase History
| Date | Buyer | Sale Price | Title Company |
|---|---|---|---|
| Sanders Laura J | $79,500 | Security Title | |
| Tolbert Cella J | $28,000 | Title America | |
| Livingston Joe B | $20,000 | Title America | |
| Hsbc Bank Usa | -- | None Available | |
| Gutierrez Anthony | $60,000 | None Available |
Source: Public Records
Mortgage History
| Date | Status | Borrower | Loan Amount |
|---|---|---|---|
| Open | Sanders Laura J | $81,090 | |
| Previous Owner | Gutierrez Anthony | $60,000 |
Source: Public Records
Tax History Compared to Growth
Tax History
| Year | Tax Paid | Tax Assessment Tax Assessment Total Assessment is a certain percentage of the fair market value that is determined by local assessors to be the total taxable value of land and additions on the property. | Land | Improvement |
|---|---|---|---|---|
| 2024 | $443 | $9,742 | $0 | $0 |
| 2023 | $443 | $6,056 | $0 | $0 |
| 2022 | $535 | $7,390 | $0 | $0 |
| 2021 | $542 | $7,603 | $0 | $0 |
| 2020 | $382 | $6,269 | $0 | $0 |
| 2019 | $384 | $6,269 | $0 | $0 |
| 2018 | $309 | $5,054 | $0 | $0 |
| 2017 | $314 | $5,054 | $0 | $0 |
| 2016 | $315 | $5,140 | $0 | $0 |
| 2015 | $311 | $5,140 | $0 | $0 |
| 2012 | $330 | $5,027 | $557 | $4,470 |
Source: Public Records
Map
Nearby Homes
- 409 Fremont Ave
- 403 Fremont St
- 411 Fremont St
- 402 Fremont St
- 410 Fremont St
- TBD T48 Hwy 115
- 307 Fremont St
- 330 4th Ave
- 211 4th Ave
- 211 Park Place
- 310 Fremont Ave
- 305 5th Ave
- 405 Grant St
- 403 Grant St
- 305 Fremont St
- 407 Grant St
- 310 Fremont St
- LOT 2 Vietnam Veterans Memorial Hwy
- LOT 3 Vietnam Veterans Memorial Hwy
- 8997 Vietnam Veterans Memorial Hwy Unit n/a