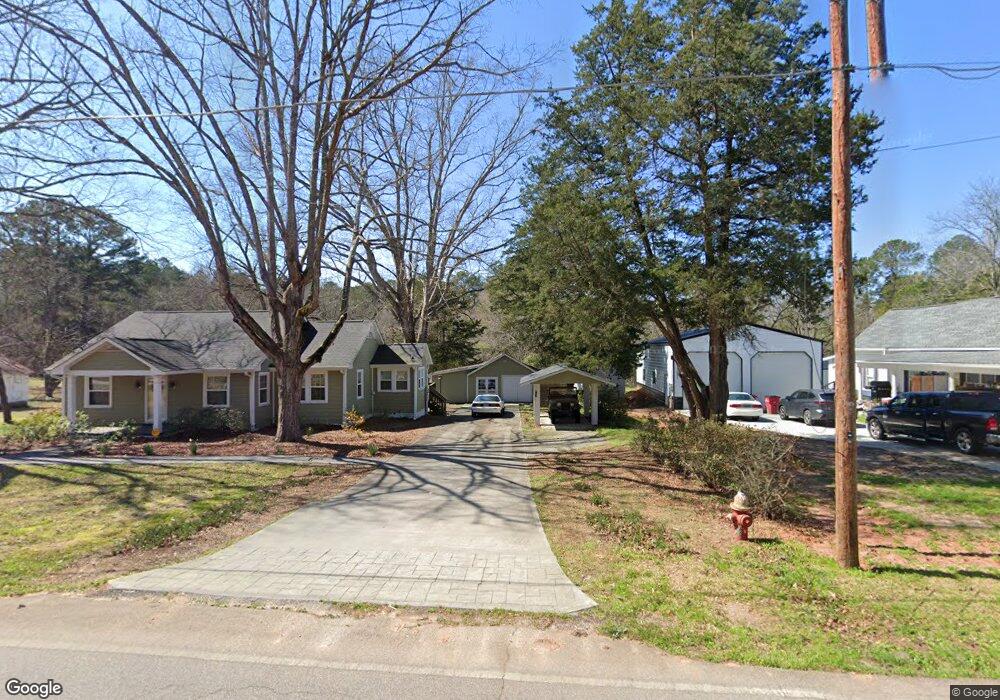
409 Goshen St Lincolnton, GA 30817
Estimated Value: $141,000 - $224,000
3
Beds
2
Baths
1,238
Sq Ft
$141/Sq Ft
Est. Value
About This Home
This home is located at 409 Goshen St, Lincolnton, GA 30817 and is currently estimated at $174,835, approximately $141 per square foot. 409 Goshen St is a home located in Lincoln County with nearby schools including Lincoln County Elementary School, Lincoln County Middle School, and Lincoln County High School.
Ownership History
Date
Name
Owned For
Owner Type
Purchase Details
Closed on
Jun 24, 2020
Sold by
Wagner Richard A
Bought by
Wagner Beverly A
Current Estimated Value
Purchase Details
Closed on
Oct 31, 2014
Sold by
Gibson Wayne
Bought by
Wagner Richard A
Home Financials for this Owner
Home Financials are based on the most recent Mortgage that was taken out on this home.
Original Mortgage
$52,000
Interest Rate
4.26%
Mortgage Type
New Conventional
Purchase Details
Closed on
Jan 21, 2000
Sold by
Neitzer Ronald and Neitzer Lor
Bought by
Gibson Wayne
Purchase Details
Closed on
Feb 14, 1995
Sold by
Chafin Wayne
Bought by
Neitzer Ronald and Neitzer Lorraine K
Purchase Details
Closed on
Feb 24, 1976
Bought by
Chafin Wayne T
Purchase Details
Closed on
May 4, 1957
Bought by
Chafin Wayne T
Create a Home Valuation Report for This Property
The Home Valuation Report is an in-depth analysis detailing your home's value as well as a comparison with similar homes in the area
Home Values in the Area
Average Home Value in this Area
Purchase History
| Date | Buyer | Sale Price | Title Company |
|---|---|---|---|
| Wagner Beverly A | -- | -- | |
| Wagner Richard A | $65,000 | -- | |
| Gibson Wayne | $55,000 | -- | |
| Neitzer Ronald | $35,000 | -- | |
| Chafin Wayne T | -- | -- | |
| Chafin Wayne T | -- | -- |
Source: Public Records
Mortgage History
| Date | Status | Borrower | Loan Amount |
|---|---|---|---|
| Previous Owner | Wagner Richard A | $52,000 |
Source: Public Records
Tax History Compared to Growth
Tax History
| Year | Tax Paid | Tax Assessment Tax Assessment Total Assessment is a certain percentage of the fair market value that is determined by local assessors to be the total taxable value of land and additions on the property. | Land | Improvement |
|---|---|---|---|---|
| 2025 | $1,559 | $50,280 | $10,480 | $39,800 |
| 2024 | $1,553 | $47,160 | $10,480 | $36,680 |
| 2023 | $1,407 | $42,592 | $10,480 | $32,112 |
| 2022 | $1,028 | $41,312 | $10,480 | $30,832 |
| 2021 | $1,058 | $38,424 | $10,480 | $27,944 |
| 2020 | $1,051 | $32,704 | $10,480 | $22,224 |
| 2019 | $1,055 | $32,704 | $10,480 | $22,224 |
| 2018 | $1,249 | $32,704 | $10,480 | $22,224 |
| 2017 | $1,097 | $28,720 | $9,400 | $19,320 |
| 2016 | $895 | $28,720 | $9,400 | $19,320 |
| 2015 | -- | $26,000 | $9,400 | $16,600 |
| 2014 | -- | $27,450 | $9,432 | $18,018 |
| 2013 | -- | $30,610 | $9,432 | $21,178 |
Source: Public Records
Map
Nearby Homes
- 116 Jackie Way
- 202 Goshen St
- 200 Cathy Way
- LOT 4 Elberton Hwy
- Lot 3a Elberton Hwy
- 00A Elberton Hwy
- 125 Goshen St
- 118 Humphrey St
- Lot 32 Eagle Point
- 570 Wallace-Wells Cir
- 0 Watson St
- 125 Elm St
- Na Metasville Rd
- 280 May Ave
- 1118 Augusta Hwy
- Lot 32 Petersburg Place
- 00 C E Norman Rd
- 32 Eagle Pointe
- 0 Pineridge Dr
- 2121 Aycock-Norman Rd
- 395 Goshen St
- 423 Goshen St
- 377 Goshen St
- 445 Goshen St
- 418 Goshen St
- 351 Goshen St
- 540 N Washington St
- 459 Goshen St
- 0 Highway 378 Unit 361706
- 0 Highway 378 Unit 401874
- 0 Highway 378 Unit 428801
- 2 Highway 378
- 0 Highway 378 Unit 479541
- 574 N Washington St
- 528 N Washington St
- 358 Goshen St
- 514 N Washington St
- 608 N Washington St
- 315 Goshen St
- 346 Goshen St