Estimated Value: $494,534 - $871,000
4
Beds
3
Baths
3,011
Sq Ft
$239/Sq Ft
Est. Value
About This Home
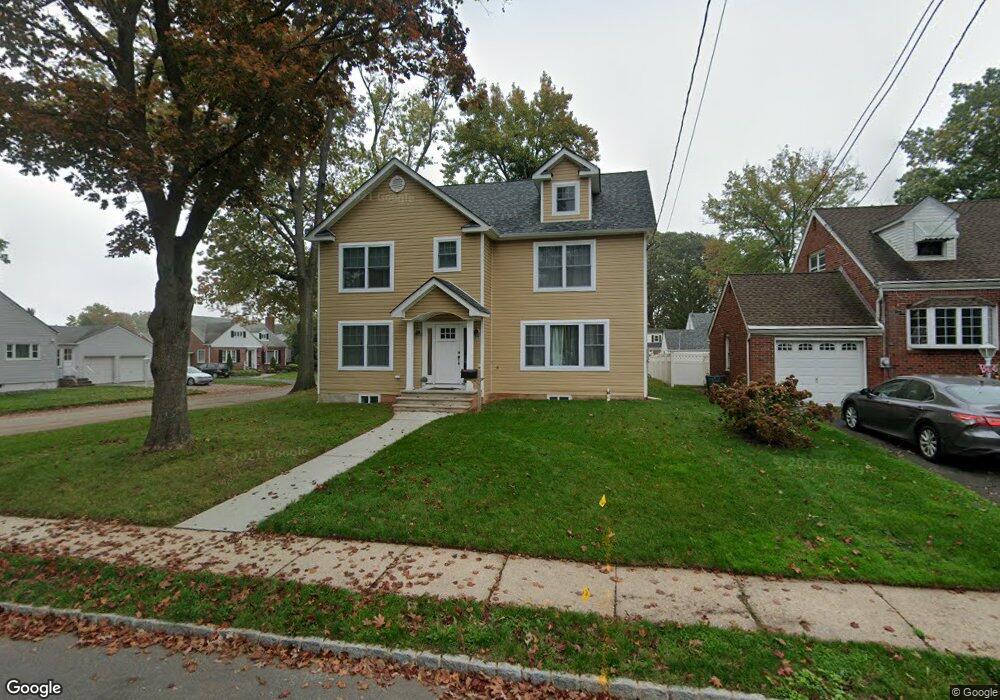
This home is located at 409 Huntington Rd, Union, NJ 07083 and is currently estimated at $719,634, approximately $239 per square foot. 409 Huntington Rd is a home located in Union County with nearby schools including Washington Elementary School and Union High School.
Ownership History
Date
Name
Owned For
Owner Type
Purchase Details
Closed on
Feb 28, 2019
Sold by
Clearview Equities Llc
Bought by
Boateng Osei and Boateng Nerissa
Current Estimated Value
Home Financials for this Owner
Home Financials are based on the most recent Mortgage that was taken out on this home.
Original Mortgage
$468,000
Interest Rate
4.4%
Mortgage Type
New Conventional
Purchase Details
Closed on
Mar 21, 2017
Sold by
Cryan Joseph
Bought by
Clearview Equities Llc
Purchase Details
Closed on
Oct 19, 2005
Sold by
Melendez Jose
Bought by
Melendez Jose and Melendez Carmen L
Purchase Details
Closed on
Jun 6, 2002
Sold by
Schneider Dorothy A and Schneider Robert W
Bought by
Melendez Jose and Melendez Carmine
Home Financials for this Owner
Home Financials are based on the most recent Mortgage that was taken out on this home.
Original Mortgage
$241,062
Interest Rate
6.79%
Mortgage Type
FHA
Create a Home Valuation Report for This Property
The Home Valuation Report is an in-depth analysis detailing your home's value as well as a comparison with similar homes in the area
Home Values in the Area
Average Home Value in this Area
Purchase History
| Date | Buyer | Sale Price | Title Company |
|---|---|---|---|
| Boateng Osei | $585,000 | Acres Land Title Agency Inc | |
| Clearview Equities Llc | $210,000 | None Available | |
| Melendez Jose | -- | -- | |
| Melendez Jose | $250,000 | -- |
Source: Public Records
Mortgage History
| Date | Status | Borrower | Loan Amount |
|---|---|---|---|
| Previous Owner | Boateng Osei | $468,000 | |
| Previous Owner | Melendez Jose | $241,062 |
Source: Public Records
Tax History Compared to Growth
Tax History
| Year | Tax Paid | Tax Assessment Tax Assessment Total Assessment is a certain percentage of the fair market value that is determined by local assessors to be the total taxable value of land and additions on the property. | Land | Improvement |
|---|---|---|---|---|
| 2025 | $17,546 | $78,500 | $20,600 | $57,900 |
| 2024 | $17,010 | $78,500 | $20,600 | $57,900 |
| 2023 | $17,010 | $78,500 | $20,600 | $57,900 |
| 2022 | $16,419 | $78,500 | $20,600 | $57,900 |
| 2021 | $16,021 | $78,500 | $20,600 | $57,900 |
| 2020 | $15,702 | $78,500 | $20,600 | $57,900 |
| 2019 | $15,490 | $78,500 | $20,600 | $57,900 |
| 2018 | $10,358 | $53,400 | $20,600 | $32,800 |
| 2017 | $10,205 | $53,400 | $20,600 | $32,800 |
| 2016 | $9,956 | $53,400 | $20,600 | $32,800 |
| 2015 | $9,791 | $53,400 | $20,600 | $32,800 |
| 2014 | $9,571 | $53,400 | $20,600 | $32,800 |
Source: Public Records
Map
Nearby Homes
- 394 Martin Rd
- 393 Forest Dr
- 403 Foxwood Rd
- 321 Salem Rd
- 536 Lehigh Ave
- 819 Greenwich Ln
- 578 Winchester Ave
- 341 Trotting Rd
- 355 Sycamore Dr
- 686 Gates Terrace
- 233 Monticello St
- 668 Lehigh Ave
- 617 Sherman Ave
- 275 Clermont Terrace
- 1177 Edgewood Pkwy
- 504 E Lincoln Ave
- 526 Robinson Terrace
- 302 E Lincoln Ave
- 494 Whitewood Rd
- 255 Tucker Ave Unit 233
- 403 Huntington Rd
- 408 Martin Rd
- 399 Huntington Rd
- 404 Martin Rd
- 421 Huntington Rd
- 400 Martin Rd
- 408 Huntington Rd
- 412 Huntington Rd
- 395 Huntington Rd
- 404 Huntington Rd
- 416 Huntington Rd
- 429 Huntington Rd
- 400 Huntington Rd
- 420 Huntington Rd
- 393 Huntington Rd
- 903 Randolph Place
- 396 Huntington Rd
- 390 Martin Rd
- 411 Martin Rd
- 424 Huntington Rd