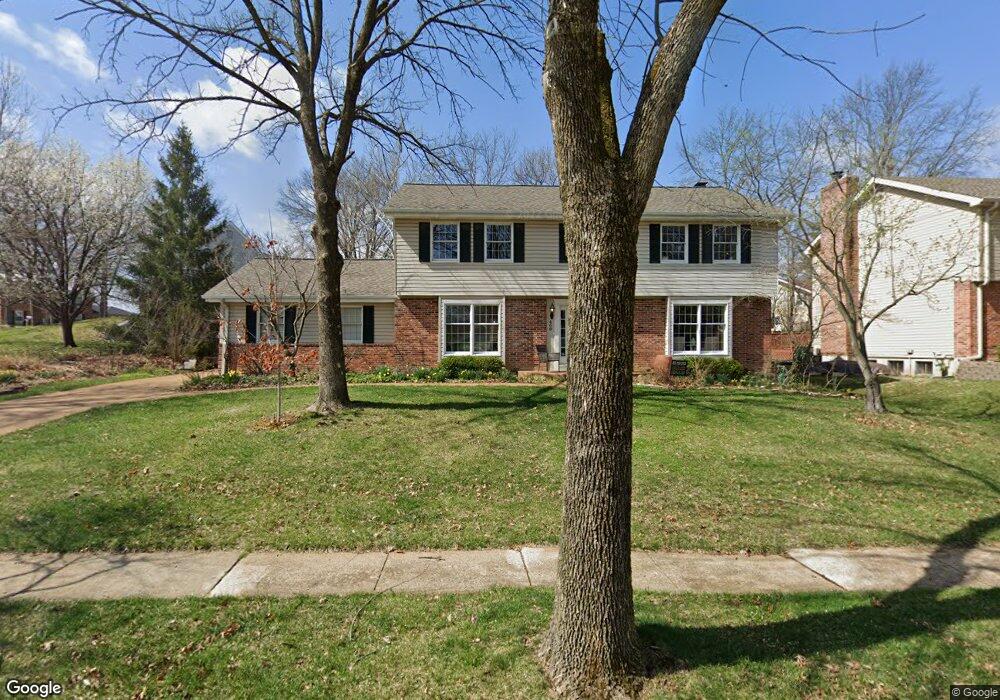
409 Lexbridge Ln Ballwin, MO 63011
Estimated Value: $508,000 - $588,000
4
Beds
3
Baths
3,037
Sq Ft
$182/Sq Ft
Est. Value
About This Home
This home is located at 409 Lexbridge Ln, Ballwin, MO 63011 and is currently estimated at $553,480, approximately $182 per square foot. 409 Lexbridge Ln is a home located in St. Louis County with nearby schools including Claymont Elementary School, Parkway West Middle School, and Parkway West High School.
Ownership History
Date
Name
Owned For
Owner Type
Purchase Details
Closed on
Jun 17, 2011
Sold by
Schenk Mary Gail and Schenk George E
Bought by
Mclellan Ii Michael D and Mclellan April T
Current Estimated Value
Home Financials for this Owner
Home Financials are based on the most recent Mortgage that was taken out on this home.
Original Mortgage
$272,000
Outstanding Balance
$188,476
Interest Rate
4.74%
Mortgage Type
New Conventional
Estimated Equity
$365,004
Purchase Details
Closed on
Feb 15, 2002
Sold by
Schenk Mary Gail and Schenk George E
Bought by
Schenk George E and Schenk Mary Gail
Home Financials for this Owner
Home Financials are based on the most recent Mortgage that was taken out on this home.
Original Mortgage
$185,000
Interest Rate
3.37%
Mortgage Type
Stand Alone First
Purchase Details
Closed on
Aug 11, 1998
Sold by
Schenk George E and Schenk Gail Mary
Bought by
Schenk Mary Gail and Schenk George E
Create a Home Valuation Report for This Property
The Home Valuation Report is an in-depth analysis detailing your home's value as well as a comparison with similar homes in the area
Home Values in the Area
Average Home Value in this Area
Purchase History
| Date | Buyer | Sale Price | Title Company |
|---|---|---|---|
| Mclellan Ii Michael D | $340,000 | Ust | |
| Schenk George E | -- | -- | |
| Schenk Mary Gail | -- | -- |
Source: Public Records
Mortgage History
| Date | Status | Borrower | Loan Amount |
|---|---|---|---|
| Open | Mclellan Ii Michael D | $272,000 | |
| Previous Owner | Schenk George E | $185,000 |
Source: Public Records
Tax History
| Year | Tax Paid | Tax Assessment Tax Assessment Total Assessment is a certain percentage of the fair market value that is determined by local assessors to be the total taxable value of land and additions on the property. | Land | Improvement |
|---|---|---|---|---|
| 2025 | $5,583 | $93,520 | $34,680 | $58,840 |
| 2024 | $5,583 | $86,300 | $23,660 | $62,640 |
| 2023 | $5,504 | $86,300 | $23,660 | $62,640 |
| 2022 | $5,098 | $72,630 | $19,700 | $52,930 |
| 2021 | $5,068 | $72,630 | $19,700 | $52,930 |
| 2020 | $5,010 | $68,040 | $19,360 | $48,680 |
| 2019 | $4,953 | $68,040 | $19,360 | $48,680 |
| 2018 | $4,973 | $63,380 | $17,440 | $45,940 |
| 2016 | $4,452 | $55,550 | $12,690 | $42,860 |
Source: Public Records
Map
Nearby Homes
- 416 Caprice Gardens Ct
- 435 Holly Terrace Ct
- 351 Greenbriar Ln
- 421 Andover Ln
- 107 Falmouth Dr
- 27 Meadowbrook Country Club Estate
- 239 E Skyline Dr
- 521 Kehrs Mill Rd
- 242 Aspen Trail Dr
- 913 Crestland Dr
- 127 Ivy Ct
- 816 Crestland Dr
- 1019 Claytonbrook Dr Unit 1019
- 922 Claytonbrook Dr Unit 1
- 916 Claytonbrook Dr Unit 1
- 202 Wildbrier Dr
- 927 Claytonbrook Dr Unit 3
- 1026 Kehrs Mill Rd Unit 4
- 94 Meadowbrook Country Club Estates
- 974 Claytonbrook Dr Unit 1A
- 417 Lexbridge Ln
- 527 Kenilworth Ln
- 536 Briarwyck Dr
- 531 Kenilworth Ln
- 350 Kenilworth Ct
- 408 Lexbridge Ln
- 425 Lexbridge Ln
- 418 Lexbridge Ln
- 530 Briarwyck Dr
- 518 Kenilworth Ln
- 542 Briarwyck Dr
- 535 Kenilworth Ln
- 426 Lexbridge Ln
- 526 Kenilworth Ln
- 351 Kenilworth Ct
- 435 Lexbridge Ln
- 517 Kenilworth Ln
- 530 Kenilworth Ln
- 348 Kenilworth Ct
- 514 Kenilworth Ln
Your Personal Tour Guide
Ask me questions while you tour the home.