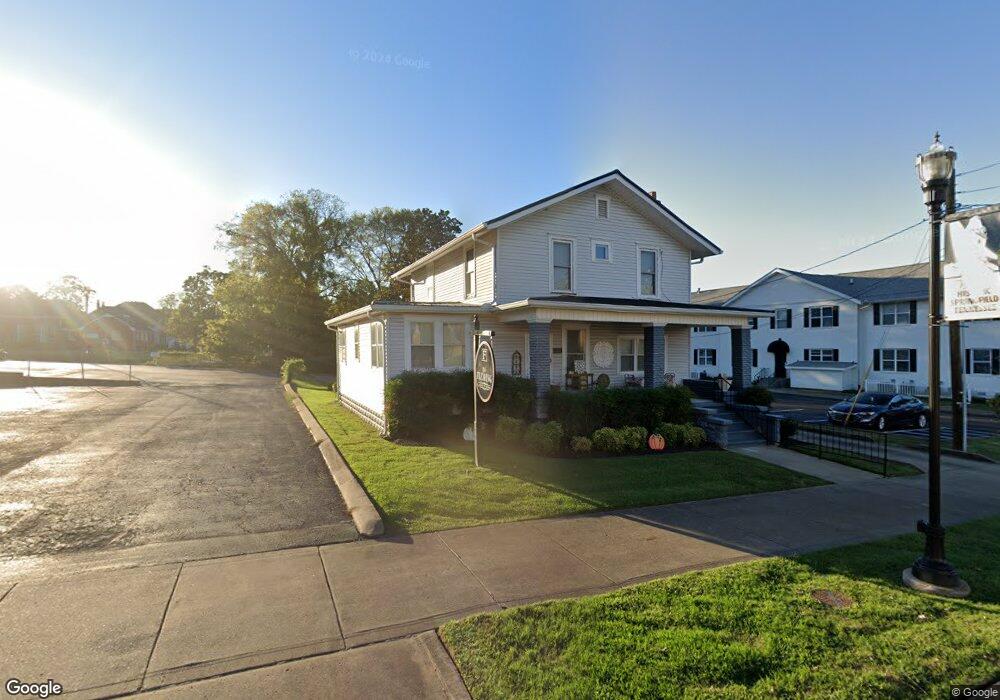
409 Locust St Springfield, TN 37172
Estimated Value: $375,000 - $442,000
Studio
2
Baths
2,016
Sq Ft
$206/Sq Ft
Est. Value
About This Home
This home is located at 409 Locust St, Springfield, TN 37172 and is currently estimated at $414,296, approximately $205 per square foot. 409 Locust St is a home located in Robertson County with nearby schools including Cheatham Park Elementary School, Westside Elementary School, and Innovation Academy.
Ownership History
Date
Name
Owned For
Owner Type
Purchase Details
Closed on
Sep 30, 2024
Sold by
Bevis Charlotte Ulintz Fleming and Fleming Charlotte U
Bought by
Wilmoth Peacock Properties Llc
Current Estimated Value
Purchase Details
Closed on
Sep 27, 2019
Sold by
Bevis Daniel K
Bought by
Fleming Bevis Charlotte Ulintz
Purchase Details
Closed on
Jul 15, 2014
Sold by
Laborg Michael P
Bought by
Fleming Charlotte U and Bevis Daniel K
Home Financials for this Owner
Home Financials are based on the most recent Mortgage that was taken out on this home.
Original Mortgage
$145,000
Interest Rate
4.24%
Mortgage Type
New Conventional
Purchase Details
Closed on
May 11, 2009
Sold by
Onstott Mary Dudley
Bought by
Laborg Michael P
Purchase Details
Closed on
Nov 7, 2000
Sold by
Mike Laborg
Bought by
Mike Laborg
Home Financials for this Owner
Home Financials are based on the most recent Mortgage that was taken out on this home.
Original Mortgage
$29,000
Interest Rate
7.93%
Purchase Details
Closed on
Feb 17, 1996
Bought by
Reddick Douglas C
Purchase Details
Closed on
Feb 3, 1996
Bought by
Henderson David A
Purchase Details
Closed on
Nov 23, 1992
Bought by
Laborg Mike and Rigsby Richard D
Purchase Details
Closed on
Mar 24, 1981
Bought by
Elliott John Y
Create a Home Valuation Report for This Property
The Home Valuation Report is an in-depth analysis detailing your home's value as well as a comparison with similar homes in the area
Home Values in the Area
Average Home Value in this Area
Purchase History
| Date | Buyer | Sale Price | Title Company |
|---|---|---|---|
| Wilmoth Peacock Properties Llc | $450,000 | None Listed On Document | |
| Fleming Bevis Charlotte Ulintz | -- | None Available | |
| Fleming Charlotte U | $150,000 | -- | |
| Laborg Michael P | -- | -- | |
| Mike Laborg | -- | -- | |
| Reddick Douglas C | $120,000 | -- | |
| Henderson David A | $110,800 | -- | |
| Laborg Mike | $22,500 | -- | |
| Elliott John Y | -- | -- |
Source: Public Records
Mortgage History
| Date | Status | Borrower | Loan Amount |
|---|---|---|---|
| Previous Owner | Fleming Charlotte U | $145,000 | |
| Previous Owner | Elliott John Y | $29,000 |
Source: Public Records
Tax History
| Year | Tax Paid | Tax Assessment Tax Assessment Total Assessment is a certain percentage of the fair market value that is determined by local assessors to be the total taxable value of land and additions on the property. | Land | Improvement |
|---|---|---|---|---|
| 2025 | -- | $102,720 | $25,440 | $77,280 |
| 2024 | -- | $102,720 | $25,440 | $77,280 |
| 2023 | $2,573 | $102,720 | $25,440 | $77,280 |
| 2022 | $2,466 | $67,600 | $8,880 | $58,720 |
| 2021 | $2,466 | $67,600 | $8,880 | $58,720 |
| 2020 | $2,466 | $67,600 | $8,880 | $58,720 |
| 2019 | $49,359 | $45,000 | $8,880 | $36,120 |
| 2018 | $1,641 | $45,000 | $8,880 | $36,120 |
| 2017 | $1,551 | $36,200 | $8,000 | $28,200 |
| 2016 | $1,551 | $36,200 | $8,000 | $28,200 |
| 2015 | $1,506 | $36,200 | $8,000 | $28,200 |
| 2014 | $1,506 | $36,200 | $8,000 | $28,200 |
Source: Public Records
Map
Nearby Homes
Your Personal Tour Guide
Ask me questions while you tour the home.