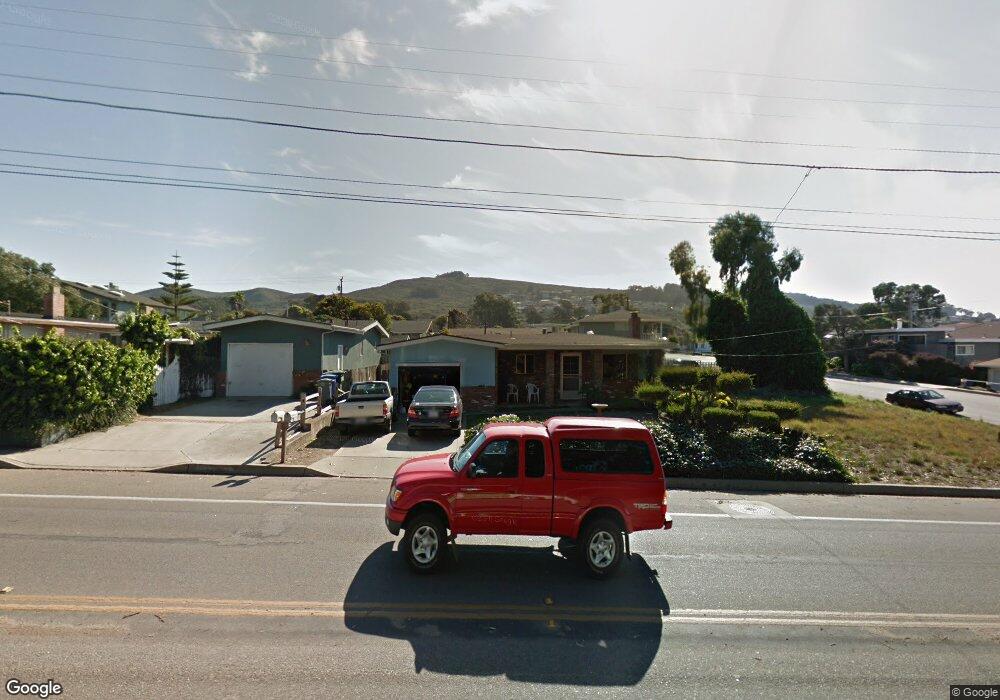
409 Los Osos Valley Rd Los Osos, CA 93402
Estimated Value: $757,013 - $815,000
3
Beds
2
Baths
1,384
Sq Ft
$567/Sq Ft
Est. Value
About This Home
This home is located at 409 Los Osos Valley Rd, Los Osos, CA 93402 and is currently estimated at $785,003, approximately $567 per square foot. 409 Los Osos Valley Rd is a home located in San Luis Obispo County with nearby schools including Monarch Grove Elementary School, Los Osos Middle School, and Morro Bay High School.
Ownership History
Date
Name
Owned For
Owner Type
Purchase Details
Closed on
Sep 5, 2011
Sold by
Abert Steven H and Abert Gail T
Bought by
Abert Steven H and Abert Gail T
Current Estimated Value
Home Financials for this Owner
Home Financials are based on the most recent Mortgage that was taken out on this home.
Original Mortgage
$132,600
Interest Rate
4.26%
Mortgage Type
New Conventional
Purchase Details
Closed on
Sep 7, 2007
Sold by
Abert Steven H and Abert Gail T
Bought by
Abert Steven H and Abert Gail T
Purchase Details
Closed on
Sep 1, 1995
Sold by
Va
Bought by
Abert Steven H and Abert Gail T
Home Financials for this Owner
Home Financials are based on the most recent Mortgage that was taken out on this home.
Original Mortgage
$75,000
Interest Rate
7.88%
Create a Home Valuation Report for This Property
The Home Valuation Report is an in-depth analysis detailing your home's value as well as a comparison with similar homes in the area
Home Values in the Area
Average Home Value in this Area
Purchase History
| Date | Buyer | Sale Price | Title Company |
|---|---|---|---|
| Abert Steven H | -- | Accommodation | |
| Abert Steven H | -- | Fidelity National Title Co | |
| Abert Steven H | -- | None Available | |
| Abert Steven H | -- | Chicago Title Co |
Source: Public Records
Mortgage History
| Date | Status | Borrower | Loan Amount |
|---|---|---|---|
| Previous Owner | Abert Steven H | $132,600 | |
| Previous Owner | Abert Steven H | $75,000 |
Source: Public Records
Tax History Compared to Growth
Tax History
| Year | Tax Paid | Tax Assessment Tax Assessment Total Assessment is a certain percentage of the fair market value that is determined by local assessors to be the total taxable value of land and additions on the property. | Land | Improvement |
|---|---|---|---|---|
| 2025 | $4,617 | $174,413 | $56,584 | $117,829 |
| 2024 | $4,486 | $170,994 | $55,475 | $115,519 |
| 2023 | $4,486 | $167,642 | $54,388 | $113,254 |
| 2022 | $4,481 | $164,356 | $53,322 | $111,034 |
| 2021 | $4,384 | $161,134 | $52,277 | $108,857 |
| 2020 | $4,190 | $159,482 | $51,741 | $107,741 |
| 2019 | $4,122 | $156,356 | $50,727 | $105,629 |
| 2018 | $3,934 | $153,291 | $49,733 | $103,558 |
| 2017 | $3,979 | $150,286 | $48,758 | $101,528 |
| 2016 | $2,552 | $147,340 | $47,802 | $99,538 |
| 2015 | $2,527 | $145,127 | $47,084 | $98,043 |
| 2014 | $2,394 | $142,285 | $46,162 | $96,123 |
Source: Public Records
Map
Nearby Homes
- 409 Manzanita Dr
- 1745 Doris Ave
- 449 Mar Vista Dr
- 2045 Pine Ave
- 532 Mar Vista Dr
- 480 Skyline Dr
- 0 Ash St
- 1840 Pine Ave
- 1830 Pine Ave
- 332 Grove St
- 0 Garden St
- 2493 San Sebastian Ln
- 633 Ramona Ave Unit 24
- 495 Ramona Ave
- 2249 Glenn St
- 224 Butte Dr
- 2117 Glenn St
- 781 Los Osos Valley Rd
- 2796 Crockett Cir
- 2331 Humboldt St
- 400 Los Osos Valley Rd
- 417 Los Osos Valley Rd
- 425 Los Osos Valley Rd
- 408 Woodland Dr
- 2250 Doris Ave
- 416 Woodland Dr
- 433 Los Osos Valley Rd
- 424 Woodland Dr
- 397 Los Osos Valley Rd
- 432 Woodland Dr
- 392 Woodland Dr
- 441 Los Osos Valley Rd
- 440 Woodland Dr
- 388 Woodland Dr
- 420 Los Osos Valley Rd
- 430 Los Osos Valley Rd
- 449 Los Osos Valley Rd
- 393 Los Osos Valley Rd
- 448 Woodland Dr
- 409 Woodland Dr