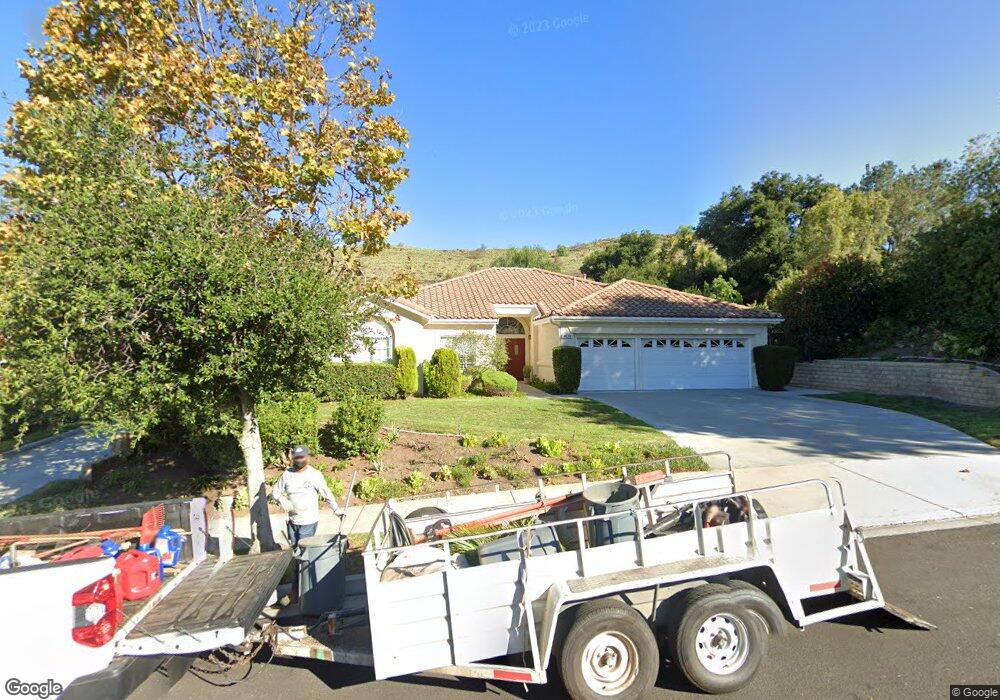
409 Lucero St Thousand Oaks, CA 91360
Estimated Value: $1,140,000 - $1,228,000
3
Beds
3
Baths
2,377
Sq Ft
$489/Sq Ft
Est. Value
About This Home
This home is located at 409 Lucero St, Thousand Oaks, CA 91360 and is currently estimated at $1,163,450, approximately $489 per square foot. 409 Lucero St is a home located in Ventura County with nearby schools including Weathersfield Elementary School, Los Cerritos Middle School, and Thousand Oaks High School.
Ownership History
Date
Name
Owned For
Owner Type
Purchase Details
Closed on
May 24, 2016
Sold by
Hsiung Judy Kwaimay
Bought by
Hsiung Judy Kwaimay
Current Estimated Value
Purchase Details
Closed on
Sep 2, 2015
Sold by
Hsiung Judy Kwai May
Bought by
Hsiung Judy Kwaimay
Home Financials for this Owner
Home Financials are based on the most recent Mortgage that was taken out on this home.
Original Mortgage
$200,000
Outstanding Balance
$77,245
Interest Rate
3.11%
Mortgage Type
New Conventional
Estimated Equity
$1,086,205
Purchase Details
Closed on
Feb 4, 2009
Sold by
Hsiung Henry Chien Hsin and Hsiung Judy Kwai May
Bought by
Hsiung Henry Chien Hsin and Hsiung Judy Kwai May
Purchase Details
Closed on
Jan 10, 1996
Sold by
Beazer Homes California Inc
Bought by
Hsiung Henry Chien Hsin and Hsiung Judy Kwai May
Home Financials for this Owner
Home Financials are based on the most recent Mortgage that was taken out on this home.
Original Mortgage
$207,000
Interest Rate
6.55%
Create a Home Valuation Report for This Property
The Home Valuation Report is an in-depth analysis detailing your home's value as well as a comparison with similar homes in the area
Home Values in the Area
Average Home Value in this Area
Purchase History
| Date | Buyer | Sale Price | Title Company |
|---|---|---|---|
| Hsiung Judy Kwaimay | -- | None Available | |
| Hsiung Judy Kwaimay | -- | Equity Title Company | |
| Hsiung Henry Chien Hsin | -- | None Available | |
| Hsiung Henry Chien Hsin | $303,000 | Chicago Title |
Source: Public Records
Mortgage History
| Date | Status | Borrower | Loan Amount |
|---|---|---|---|
| Open | Hsiung Judy Kwaimay | $200,000 | |
| Closed | Hsiung Henry Chien Hsin | $207,000 |
Source: Public Records
Tax History Compared to Growth
Tax History
| Year | Tax Paid | Tax Assessment Tax Assessment Total Assessment is a certain percentage of the fair market value that is determined by local assessors to be the total taxable value of land and additions on the property. | Land | Improvement |
|---|---|---|---|---|
| 2025 | $6,110 | $503,322 | $201,324 | $301,998 |
| 2024 | $6,110 | $493,453 | $197,376 | $296,077 |
| 2023 | $5,925 | $483,778 | $193,506 | $290,272 |
| 2022 | $5,806 | $474,293 | $189,712 | $284,581 |
| 2021 | $5,687 | $464,994 | $185,993 | $279,001 |
| 2020 | $5,254 | $460,228 | $184,087 | $276,141 |
| 2019 | $5,115 | $451,205 | $180,478 | $270,727 |
| 2018 | $5,010 | $442,359 | $176,940 | $265,419 |
| 2017 | $4,909 | $433,686 | $173,471 | $260,215 |
| 2016 | $4,858 | $425,183 | $170,070 | $255,113 |
| 2015 | $4,697 | $418,798 | $167,516 | $251,282 |
| 2014 | $4,625 | $410,596 | $164,236 | $246,360 |
Source: Public Records
Map
Nearby Homes
- 3931 Bucklin Place
- 221 Mcafee Ct
- 3275 Camino Calandria
- 1076 Calle Contento
- 87 Mcafee Ct
- 73 Mcafee Ct
- 1134 Calle Pinata
- 3342 Heatherglow St
- 4850 N Moorpark Rd
- 205 Larkhill St
- 416 Camino Dos Palos
- 2625 Marvella Ct
- 13550 Andalusia Dr
- 71 Del Ray Cir
- 3901 Avenida Verano
- 4296 Avenida Amelgado
- 2947 Camino Del Zuro
- 331 Briar Bluff Cir
- 1455 Calle Colina
- 1427 Calle Artigas