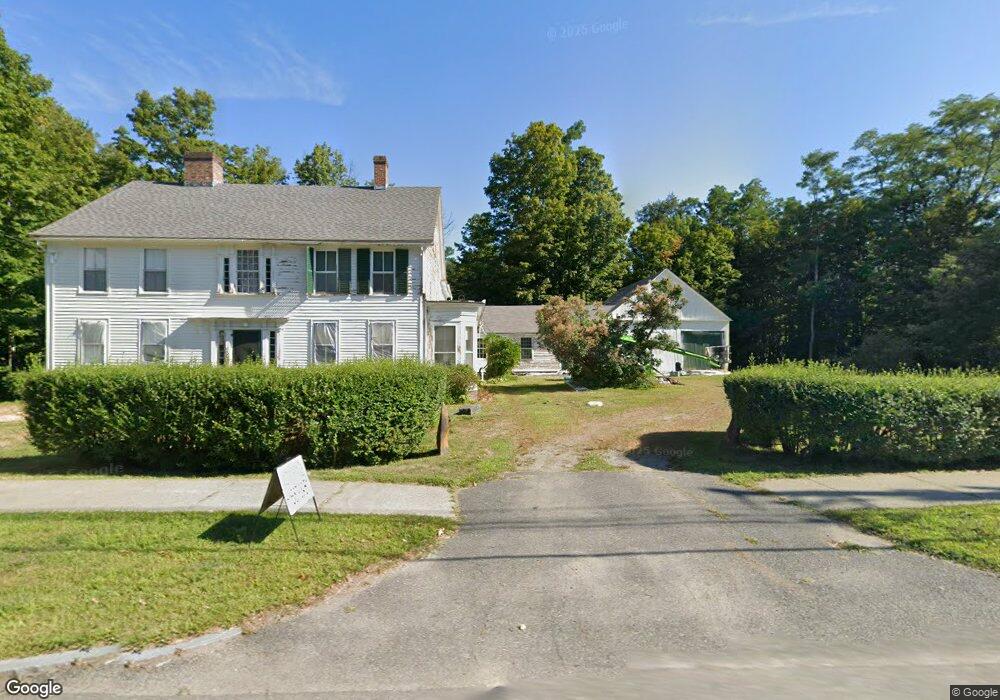
409 Main St Ashfield, MA 01330
Ashfield NeighborhoodEstimated Value: $642,000 - $742,000
6
Beds
3
Baths
4,392
Sq Ft
$161/Sq Ft
Est. Value
About This Home
This home is located at 409 Main St, Ashfield, MA 01330 and is currently estimated at $706,120, approximately $160 per square foot. 409 Main St is a home located in Franklin County with nearby schools including Mohawk Trail Regional High School.
Ownership History
Date
Name
Owned For
Owner Type
Purchase Details
Closed on
Sep 10, 2024
Sold by
Paige T T and Paige P
Bought by
Virginia B Paige Tuw B and Virginia Paige
Current Estimated Value
Purchase Details
Closed on
Aug 6, 2014
Sold by
Paige Funding T and Paige
Bought by
Paige Marital T and Paige P
Purchase Details
Closed on
Feb 16, 2010
Sold by
Mary S Paige T S and Mary Paige-Conn
Bought by
Paige Ft Llc
Create a Home Valuation Report for This Property
The Home Valuation Report is an in-depth analysis detailing your home's value as well as a comparison with similar homes in the area
Home Values in the Area
Average Home Value in this Area
Purchase History
| Date | Buyer | Sale Price | Title Company |
|---|---|---|---|
| Virginia B Paige Tuw B | -- | None Available | |
| Virginia B Paige Tuw B | -- | None Available | |
| Paige Marital T | -- | -- | |
| Paige Ft Llc | -- | -- | |
| Tejan Sally Paige | -- | -- | |
| Paige Tr Timothy T | -- | -- | |
| Paige Marital T | -- | -- | |
| Paige Tr Timothy T | -- | -- |
Source: Public Records
Tax History
| Year | Tax Paid | Tax Assessment Tax Assessment Total Assessment is a certain percentage of the fair market value that is determined by local assessors to be the total taxable value of land and additions on the property. | Land | Improvement |
|---|---|---|---|---|
| 2025 | $9,863 | $732,800 | $97,300 | $635,500 |
| 2024 | $9,979 | $683,000 | $97,300 | $585,700 |
| 2023 | $9,631 | $546,900 | $78,700 | $468,200 |
| 2022 | $9,031 | $519,600 | $75,200 | $444,400 |
| 2021 | $8,338 | $503,800 | $75,200 | $428,600 |
| 2020 | $8,393 | $503,800 | $75,200 | $428,600 |
| 2019 | $7,794 | $454,200 | $71,800 | $382,400 |
| 2018 | $7,678 | $446,900 | $71,800 | $375,100 |
| 2017 | $7,234 | $446,000 | $70,900 | $375,100 |
| 2016 | $6,851 | $416,700 | $70,900 | $345,800 |
| 2015 | $6,655 | $416,700 | $70,900 | $345,800 |
| 2014 | $6,702 | $414,700 | $66,400 | $348,300 |
Source: Public Records
Map
Nearby Homes
- 527 Main St
- 40 Suburban Dr
- 240 Beldingville Rd
- 220 Hawley Rd
- 0 N Bear River Rd Unit 73485981
- 0 Sears Rd Unit 73373850
- lot 1 Shelburne Falls Rd
- 0 John Ford Rd Unit 73403156
- 85 Dacey Rd
- 0 Upper St
- 0 Spruce Corner Rd Unit 73244975
- 333 Ranney Corner Rd
- 311 Cummington Rd
- 7 Hog Hollow Rd
- 102 Elm St
- 146 Berkshire Trail W
- 13 Bray Rd
- 10 Deerfield Ave Unit 2
- 296 E Main St
- 1451 Route 2 E
Your Personal Tour Guide
Ask me questions while you tour the home.