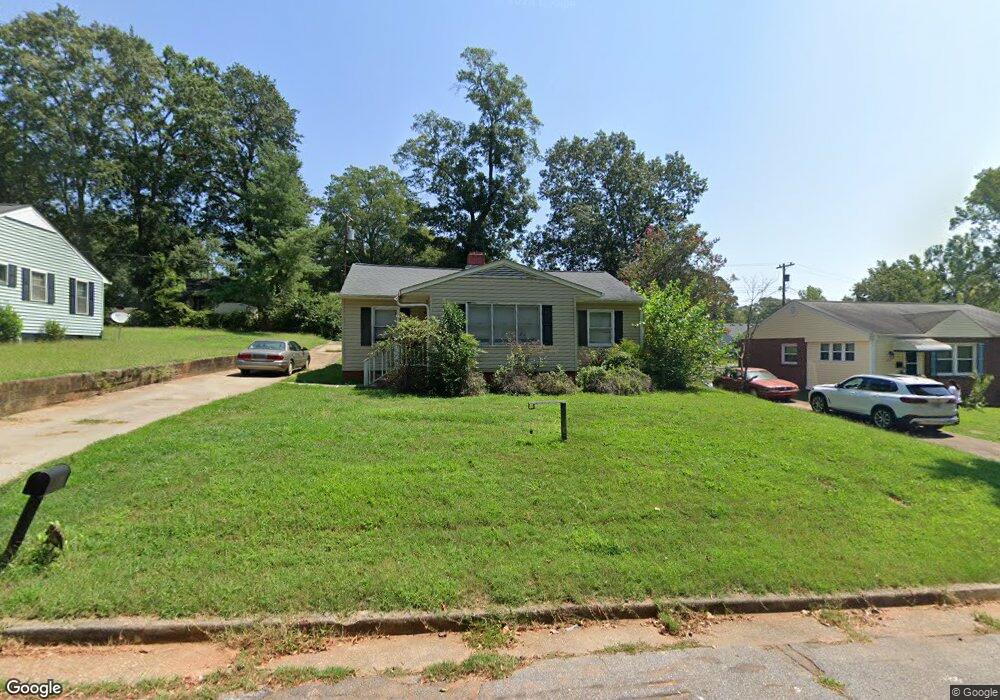
409 Montague St Anderson, SC 29624
Estimated Value: $106,321 - $157,000
3
Beds
1
Bath
1,139
Sq Ft
$107/Sq Ft
Est. Value
About This Home
This home is located at 409 Montague St, Anderson, SC 29624 and is currently estimated at $121,580, approximately $106 per square foot. 409 Montague St is a home located in Anderson County with nearby schools including New Prospect Elementary School, Robert Anderson Middle School, and Westside High School.
Ownership History
Date
Name
Owned For
Owner Type
Purchase Details
Closed on
Oct 13, 2022
Sold by
Jc Group Llc
Bought by
Robinson Group Of South Carolina Llc
Current Estimated Value
Home Financials for this Owner
Home Financials are based on the most recent Mortgage that was taken out on this home.
Original Mortgage
$69,583
Outstanding Balance
$66,950
Interest Rate
6.02%
Mortgage Type
New Conventional
Estimated Equity
$54,630
Purchase Details
Closed on
Mar 28, 2006
Sold by
Jpmorgan Chase Bank
Bought by
The Jc Group Llc
Purchase Details
Closed on
Sep 22, 2005
Sold by
Alexander Gloria J
Bought by
Jpmorgan Chase Bank
Purchase Details
Closed on
Sep 27, 2004
Sold by
Drew Sam
Bought by
Alexander Gloria J
Purchase Details
Closed on
Mar 26, 2004
Sold by
1St Citizens Bank & Tr
Bought by
Drew Sam
Purchase Details
Closed on
Jun 14, 2003
Sold by
Nicholson Donald
Bought by
Finch Jason T
Purchase Details
Closed on
Jun 12, 2003
Sold by
1St Citizens Bank & Tr
Create a Home Valuation Report for This Property
The Home Valuation Report is an in-depth analysis detailing your home's value as well as a comparison with similar homes in the area
Home Values in the Area
Average Home Value in this Area
Purchase History
| Date | Buyer | Sale Price | Title Company |
|---|---|---|---|
| Robinson Group Of South Carolina Llc | $190,000 | -- | |
| The Jc Group Llc | $36,500 | None Available | |
| Jpmorgan Chase Bank | $44,800 | -- | |
| Alexander Gloria J | $56,000 | -- | |
| Drew Sam | $18,676 | -- | |
| Elrod Brian N | $24,000 | -- | |
| Finch Jason T | $230,000 | -- | |
| -- | $20,000 | -- |
Source: Public Records
Mortgage History
| Date | Status | Borrower | Loan Amount |
|---|---|---|---|
| Open | Robinson Group Of South Carolina Llc | $69,583 |
Source: Public Records
Tax History Compared to Growth
Tax History
| Year | Tax Paid | Tax Assessment Tax Assessment Total Assessment is a certain percentage of the fair market value that is determined by local assessors to be the total taxable value of land and additions on the property. | Land | Improvement |
|---|---|---|---|---|
| 2024 | $1,656 | $3,710 | $300 | $3,410 |
| 2023 | $1,656 | $3,710 | $300 | $3,410 |
| 2022 | $1,576 | $3,710 | $300 | $3,410 |
| 2021 | $1,490 | $3,280 | $210 | $3,070 |
| 2020 | $1,474 | $3,280 | $210 | $3,070 |
| 2019 | $1,474 | $3,280 | $210 | $3,070 |
| 2018 | $1,459 | $3,280 | $210 | $3,070 |
| 2017 | -- | $3,280 | $210 | $3,070 |
| 2016 | $1,454 | $3,300 | $210 | $3,090 |
| 2015 | $1,462 | $3,300 | $210 | $3,090 |
| 2014 | $1,442 | $3,300 | $210 | $3,090 |
Source: Public Records
Map
Nearby Homes
- 407 Montague St
- 503 Montague St
- 504 Cathcart Dr
- 502 Cathcart Dr
- 505 Montague St
- 405 Montague St
- 506 Cathcart Dr
- 500 Cathcart Dr
- 500 Montague St
- 406 Montague St
- 508 Cathcart Dr
- 414 Cathcart Dr
- 502 Montague St
- 403 Montague St
- 507 Montague St
- 504 Montague St
- 501 Casey St
- 410 Cathcart Dr
- 402 Montague St
- 505 Cathcart Dr