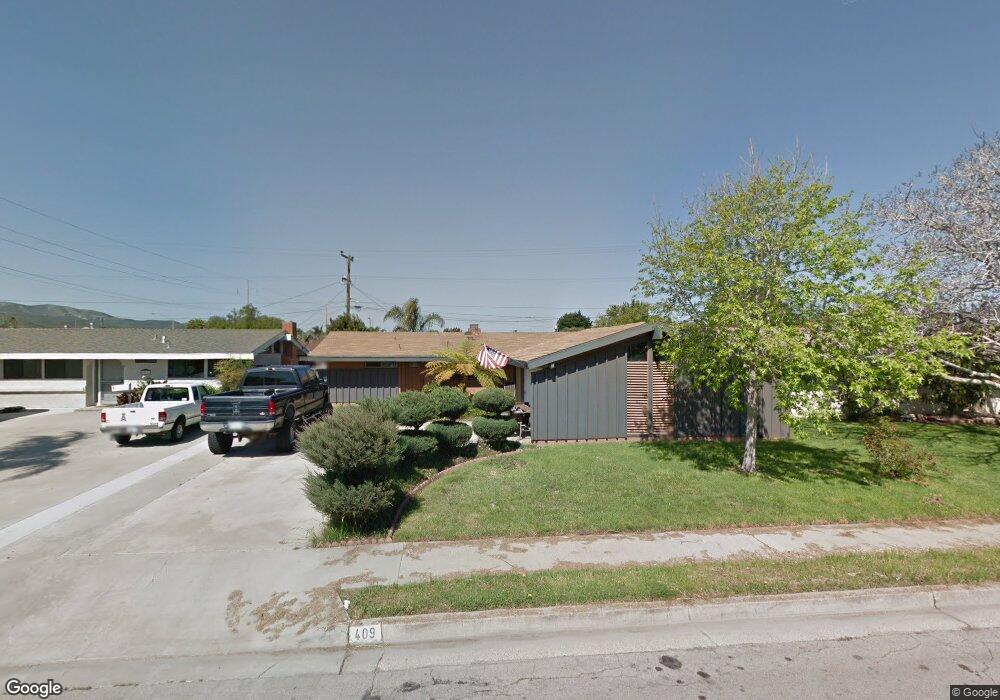
409 N 6th St Lompoc, CA 93436
Estimated Value: $489,000 - $540,000
3
Beds
2
Baths
1,200
Sq Ft
$429/Sq Ft
Est. Value
About This Home
This home is located at 409 N 6th St, Lompoc, CA 93436 and is currently estimated at $515,117, approximately $429 per square foot. 409 N 6th St is a home located in Santa Barbara County with nearby schools including Arthur Hapgood Elementary School, Lompoc Valley Middle School, and Lompoc High School.
Ownership History
Date
Name
Owned For
Owner Type
Purchase Details
Closed on
Feb 17, 2021
Sold by
Davison Neville C
Bought by
Davison Neville C and Jones Sarrah M
Current Estimated Value
Home Financials for this Owner
Home Financials are based on the most recent Mortgage that was taken out on this home.
Original Mortgage
$297,110
Interest Rate
2.9%
Mortgage Type
FHA
Purchase Details
Closed on
Jun 18, 2010
Sold by
Davison Bonnie
Bought by
Davison Neville C
Purchase Details
Closed on
Jun 12, 2001
Sold by
Davison Neville C and Davison Bonnie L
Bought by
Davison Neville C and Davison Bonnie L
Home Financials for this Owner
Home Financials are based on the most recent Mortgage that was taken out on this home.
Original Mortgage
$137,000
Interest Rate
7.14%
Create a Home Valuation Report for This Property
The Home Valuation Report is an in-depth analysis detailing your home's value as well as a comparison with similar homes in the area
Home Values in the Area
Average Home Value in this Area
Purchase History
| Date | Buyer | Sale Price | Title Company |
|---|---|---|---|
| Davison Neville C | -- | Solidifi | |
| Davison Neville C | -- | None Available | |
| Davison Neville C | -- | First American Title |
Source: Public Records
Mortgage History
| Date | Status | Borrower | Loan Amount |
|---|---|---|---|
| Closed | Davison Neville C | $297,110 | |
| Closed | Davison Neville C | $137,000 |
Source: Public Records
Tax History
| Year | Tax Paid | Tax Assessment Tax Assessment Total Assessment is a certain percentage of the fair market value that is determined by local assessors to be the total taxable value of land and additions on the property. | Land | Improvement |
|---|---|---|---|---|
| 2025 | $2,219 | $201,070 | $95,334 | $105,736 |
| 2023 | $2,219 | $193,264 | $91,633 | $101,631 |
| 2022 | $2,180 | $189,476 | $89,837 | $99,639 |
| 2021 | $2,203 | $185,762 | $88,076 | $97,686 |
| 2020 | $2,180 | $183,858 | $87,173 | $96,685 |
| 2019 | $2,143 | $180,254 | $85,464 | $94,790 |
| 2018 | $2,110 | $176,721 | $83,789 | $92,932 |
| 2017 | $2,072 | $173,257 | $82,147 | $91,110 |
| 2016 | $2,034 | $169,861 | $80,537 | $89,324 |
| 2015 | $2,019 | $167,311 | $79,328 | $87,983 |
| 2014 | $1,991 | $164,035 | $77,775 | $86,260 |
Source: Public Records
Map
Nearby Homes
- 321 N Third St
- 601 N Seventh St
- 516 N 2nd St
- 1416 E Walnut Ave
- 240 Quail Cir
- 1725 Autumn Sage Place
- 1741 River Vista Way
- 1744 River Vista Way
- 1742 River Vista Way
- 1740 River Vista Way
- 523 Live Oak Rd
- 535 Live Oak Rd
- 1739 River Vista Way
- 1729 Autumn Sage Place
- 525 Live Oak Rd
- 1730 Autumn Sage Place
- 1726 Autumn Sage Place
- 1727 Autumn Sage Place
- 1732 Autumn Sage Place
- 1743 River Vista Way
Your Personal Tour Guide
Ask me questions while you tour the home.