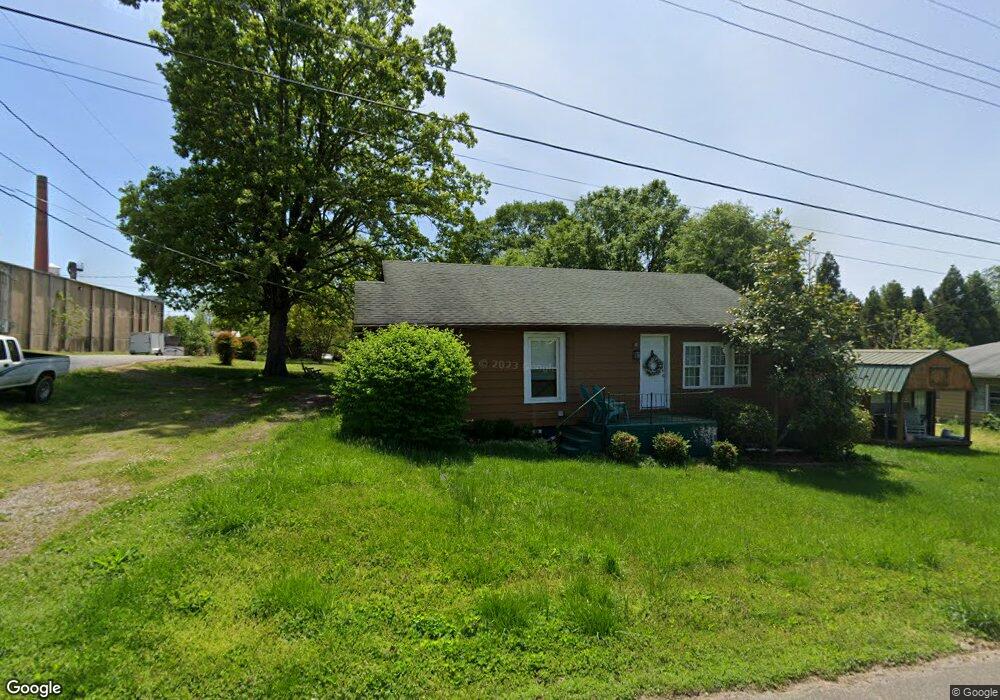
409 N Buckoak St Stanley, NC 28164
Estimated Value: $203,533 - $214,000
2
Beds
1
Bath
1,210
Sq Ft
$173/Sq Ft
Est. Value
About This Home
This home is located at 409 N Buckoak St, Stanley, NC 28164 and is currently estimated at $209,383, approximately $173 per square foot. 409 N Buckoak St is a home located in Gaston County with nearby schools including Springfield Primary School, Kiser Elementary School, and Stanley Middle School.
Ownership History
Date
Name
Owned For
Owner Type
Purchase Details
Closed on
Aug 31, 2020
Sold by
Holbrook Tammy Allison and Jones Jeffery Dean
Bought by
Lick Christine M and Rudisill Dustin Matthew
Current Estimated Value
Home Financials for this Owner
Home Financials are based on the most recent Mortgage that was taken out on this home.
Original Mortgage
$115,995
Outstanding Balance
$82,776
Interest Rate
2.9%
Mortgage Type
FHA
Estimated Equity
$126,607
Purchase Details
Closed on
Dec 19, 2019
Sold by
Armstrong Paula Marie
Bought by
Holbrook Tammy Allison
Purchase Details
Closed on
Jul 28, 2014
Sold by
Holbrook Tammy A and Jones Jeffrey Dean
Bought by
Armstrong Paula Marie and Holbrook Tammy A
Purchase Details
Closed on
Aug 19, 2009
Sold by
Pollard Sabrina and Pollard Larry
Bought by
Holbrook Tammy A
Purchase Details
Closed on
Jun 17, 2004
Sold by
Holbrook Mary P
Bought by
Holbrook Tammy A and Sorrell Lee
Purchase Details
Closed on
Aug 15, 2002
Sold by
Reid Barbara P and Powell John
Bought by
Holbrook Mary P
Create a Home Valuation Report for This Property
The Home Valuation Report is an in-depth analysis detailing your home's value as well as a comparison with similar homes in the area
Home Values in the Area
Average Home Value in this Area
Purchase History
| Date | Buyer | Sale Price | Title Company |
|---|---|---|---|
| Lick Christine M | $120,000 | Amrock | |
| Holbrook Tammy Allison | -- | None Available | |
| Armstrong Paula Marie | -- | None Available | |
| Holbrook Tammy A | -- | None Available | |
| Holbrook Tammy A | -- | -- | |
| Holbrook Mary P | -- | -- |
Source: Public Records
Mortgage History
| Date | Status | Borrower | Loan Amount |
|---|---|---|---|
| Open | Lick Christine M | $115,995 |
Source: Public Records
Tax History Compared to Growth
Tax History
| Year | Tax Paid | Tax Assessment Tax Assessment Total Assessment is a certain percentage of the fair market value that is determined by local assessors to be the total taxable value of land and additions on the property. | Land | Improvement |
|---|---|---|---|---|
| 2025 | $1,560 | $143,230 | $18,500 | $124,730 |
| 2024 | $1,560 | $143,230 | $18,500 | $124,730 |
| 2023 | $1,576 | $143,230 | $18,500 | $124,730 |
| 2022 | $875 | $64,830 | $14,000 | $50,830 |
| 2021 | $888 | $64,830 | $14,000 | $50,830 |
| 2019 | $895 | $64,830 | $14,000 | $50,830 |
| 2018 | $728 | $51,663 | $13,200 | $38,463 |
| 2017 | $728 | $51,663 | $13,200 | $38,463 |
| 2016 | $728 | $51,663 | $0 | $0 |
| 2014 | $851 | $60,380 | $16,500 | $43,880 |
Source: Public Records
Map
Nearby Homes
- 109 W Poplar St
- 107 W Poplar St
- 000 N Main St
- 500 3rd St
- 201 Valley St
- 633 N Main St
- 315 2nd St
- 308 Taylor Dr
- 124 Willow St
- 437 Valley St
- 202 Hovis Rd
- 404 N Peterson St
- 143 W College St
- 415 E Poplar St
- 526 Mariposa Rd
- 240 Vermont Dr
- 310 S Main St
- 5136 Tommy Ln Unit 1205
- 5138 Tommy Ln Unit 1204
- 5139 Tommy Ln Unit 903
- 405 N Buckoak St
- 207 Rhyne St
- 209 Rhyne St
- 403 N Buckoak St
- 201 W Poplar St
- 205 W Poplar St
- 206 W Parkwood St
- 113 W Poplar St
- 110 Rhyne St
- 100 W Parkwood St
- 606 2nd St
- 604 2nd St
- 111 W Poplar St
- 209 W Poplar St
- 600 2nd St
- 207 W Parkwood St
- 203 W Parkwood St
- 105 Rhyne St
- 213 W Poplar St
- 205 W Parkwood St