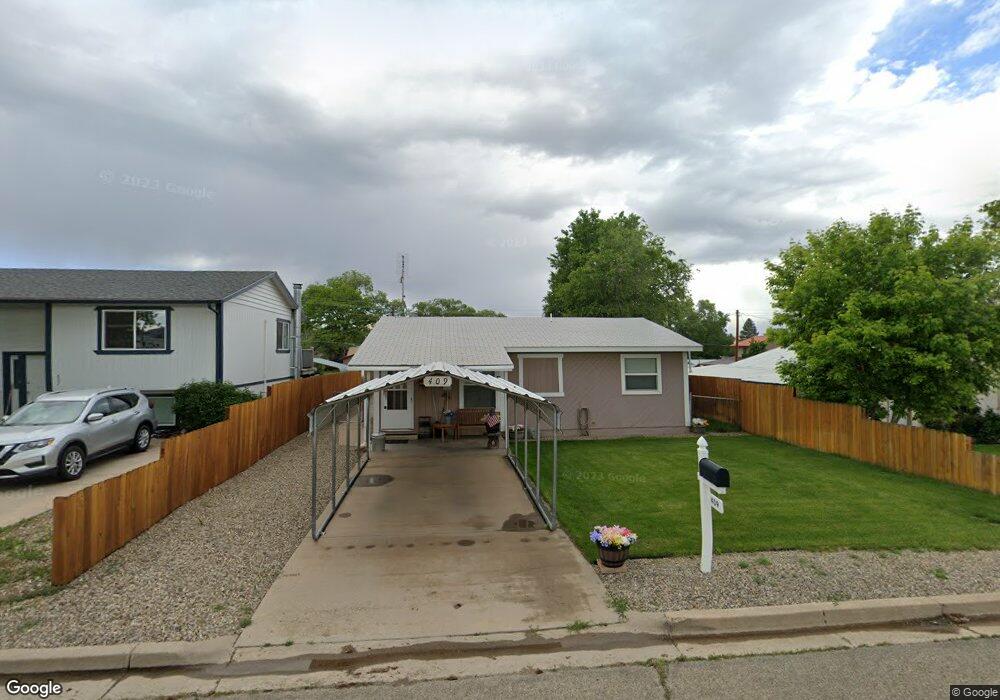
409 N Madison St Cortez, CO 81321
Estimated Value: $206,427 - $276,000
--
Bed
--
Bath
1,298
Sq Ft
$193/Sq Ft
Est. Value
About This Home
This home is located at 409 N Madison St, Cortez, CO 81321 and is currently estimated at $250,607, approximately $193 per square foot. 409 N Madison St is a home with nearby schools including Montezuma-Cortez High School, Children's Kiva Montessori School, and Children's Kiva Montessori Preschool & Kindergarten.
Ownership History
Date
Name
Owned For
Owner Type
Purchase Details
Closed on
Aug 13, 2021
Sold by
Morelock Georgia Kay
Bought by
Morelock Georgia Kay and Funk Michelle R
Current Estimated Value
Home Financials for this Owner
Home Financials are based on the most recent Mortgage that was taken out on this home.
Original Mortgage
$50,000
Outstanding Balance
$45,465
Interest Rate
2.9%
Mortgage Type
Credit Line Revolving
Estimated Equity
$205,142
Purchase Details
Closed on
Apr 14, 2006
Sold by
Hanson Stephen and Hanson Susan Kleman
Bought by
Morelock Georgia Kay
Home Financials for this Owner
Home Financials are based on the most recent Mortgage that was taken out on this home.
Original Mortgage
$119,200
Interest Rate
6.33%
Mortgage Type
USDA
Purchase Details
Closed on
Jan 29, 2002
Sold by
Goodall Carolyn S and Rowe Stacey L
Bought by
Kleiman Hanson Paul Stephen and Kleiman Hanson Susan
Create a Home Valuation Report for This Property
The Home Valuation Report is an in-depth analysis detailing your home's value as well as a comparison with similar homes in the area
Home Values in the Area
Average Home Value in this Area
Purchase History
| Date | Buyer | Sale Price | Title Company |
|---|---|---|---|
| Morelock Georgia Kay | -- | None Listed On Document | |
| Morelock Georgia Kay | $118,000 | None Available | |
| Kleiman Hanson Paul Stephen | $76,000 | -- |
Source: Public Records
Mortgage History
| Date | Status | Borrower | Loan Amount |
|---|---|---|---|
| Open | Morelock Georgia Kay | $50,000 | |
| Previous Owner | Morelock Georgia Kay | $119,200 |
Source: Public Records
Tax History Compared to Growth
Tax History
| Year | Tax Paid | Tax Assessment Tax Assessment Total Assessment is a certain percentage of the fair market value that is determined by local assessors to be the total taxable value of land and additions on the property. | Land | Improvement |
|---|---|---|---|---|
| 2024 | $225 | $8,737 | $1,649 | $7,088 |
| 2023 | $225 | $13,114 | $2,475 | $10,639 |
| 2022 | $518 | $10,720 | $1,130 | $9,590 |
| 2021 | $527 | $10,720 | $1,130 | $9,590 |
| 2020 | $462 | $9,755 | $1,243 | $8,512 |
| 2019 | $463 | $9,755 | $1,243 | $8,512 |
| 2018 | $463 | $7,260 | $1,120 | $6,140 |
| 2017 | $460 | $7,260 | $1,120 | $6,140 |
| 2016 | $396 | $6,900 | $1,240 | $5,660 |
| 2015 | $364 | $100,500 | $0 | $0 |
| 2014 | $424 | $6,900 | $0 | $0 |
Source: Public Records
Map
Nearby Homes
- 323 N Washington St
- 416 N Ash St
- 243 N Madison St
- 625 N Harrison St
- 532 E Arbecam Ave
- 506 Amanda Lee Ln
- 125 N Madison St
- 521 N Beech St
- 102 E Montezuma Ave
- TBD E Empire St
- 112 N Adams St
- 23 E Montezuma Ave
- TBD E Driscoll St
- 235 N Chestnut St Unit 6
- 122 E 1st St Unit see broker remarks
- 240 N Elm St
- 210 W Coronado Ave
- 537 N Elm St
- 145 S Madison St
- 201 S Washington St
- 407 N Madison St
- 405 N Madison St
- 411.5 N Madison
- 411 N Madison St
- 413 N Madison St
- 408 N Washington St
- 401 N Madison St
- 402 N Washington St
- 406 N Washington St
- 418 N Washington St
- 412 N Washington St
- 333 N Madison St
- N Washington St
- 312 N Washington St
- 489 N Harrison St
- 327 N Madison St
- 310 N Washington St
- 308 N Washington St
- 0 Washington Unit 648231
- 411 N Washington St