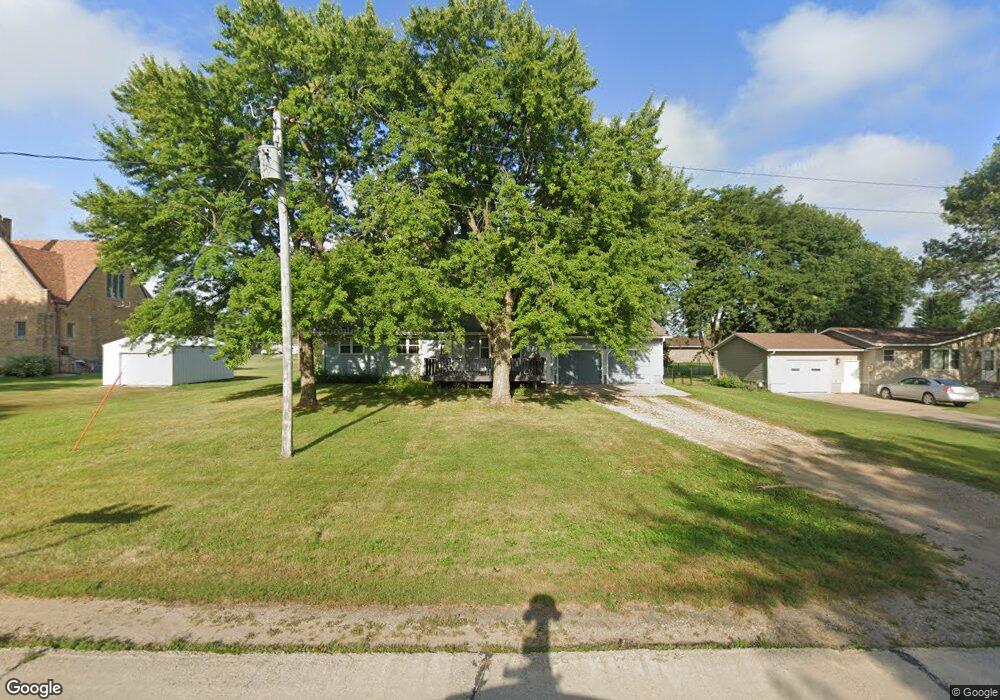
409 N State St Terril, IA 51364
Estimated Value: $89,000 - $125,000
3
Beds
1
Bath
1,008
Sq Ft
$109/Sq Ft
Est. Value
About This Home
This home is located at 409 N State St, Terril, IA 51364 and is currently estimated at $109,865, approximately $108 per square foot. 409 N State St is a home with nearby schools including Graettinger-Terril Elementary School, Graettinger-Terril High School, and Graettinger-Terril Middle School.
Ownership History
Date
Name
Owned For
Owner Type
Purchase Details
Closed on
Sep 1, 2015
Sold by
Wartnaby Charlene L
Bought by
Three Pines Properties Llc
Current Estimated Value
Home Financials for this Owner
Home Financials are based on the most recent Mortgage that was taken out on this home.
Original Mortgage
$42,800
Outstanding Balance
$33,605
Interest Rate
3.9%
Mortgage Type
New Conventional
Estimated Equity
$76,260
Purchase Details
Closed on
Mar 9, 2010
Sold by
Federal National Mortgage Association
Bought by
Wartnaby Archie and Wartnaby Charlene L
Purchase Details
Closed on
Nov 4, 2009
Sold by
Mccullah Mark Allen
Bought by
Everhome Mortgage Co
Purchase Details
Closed on
Dec 14, 2004
Sold by
Federal Home Loan Mortgage Corporation
Bought by
Mccullah Mark Allen
Home Financials for this Owner
Home Financials are based on the most recent Mortgage that was taken out on this home.
Original Mortgage
$59,000
Interest Rate
5.78%
Mortgage Type
New Conventional
Create a Home Valuation Report for This Property
The Home Valuation Report is an in-depth analysis detailing your home's value as well as a comparison with similar homes in the area
Home Values in the Area
Average Home Value in this Area
Purchase History
| Date | Buyer | Sale Price | Title Company |
|---|---|---|---|
| Three Pines Properties Llc | $50,500 | None Available | |
| Wartnaby Archie | -- | None Available | |
| Everhome Mortgage Co | $50,692 | None Available | |
| Mccullah Mark Allen | $59,000 | None Available |
Source: Public Records
Mortgage History
| Date | Status | Borrower | Loan Amount |
|---|---|---|---|
| Open | Three Pines Properties Llc | $42,800 | |
| Previous Owner | Mccullah Mark Allen | $59,000 |
Source: Public Records
Tax History Compared to Growth
Tax History
| Year | Tax Paid | Tax Assessment Tax Assessment Total Assessment is a certain percentage of the fair market value that is determined by local assessors to be the total taxable value of land and additions on the property. | Land | Improvement |
|---|---|---|---|---|
| 2025 | $1,124 | $113,000 | $8,100 | $104,900 |
| 2024 | $1,124 | $83,300 | $6,700 | $76,600 |
| 2023 | $1,046 | $83,300 | $6,700 | $76,600 |
| 2022 | $1,014 | $66,100 | $3,700 | $62,400 |
| 2021 | $1,014 | $66,100 | $3,700 | $62,400 |
| 2020 | $792 | $54,800 | $3,300 | $51,500 |
| 2019 | $786 | $54,800 | $3,300 | $51,500 |
| 2018 | $790 | $53,100 | $2,900 | $50,200 |
| 2017 | $790 | $53,100 | $2,900 | $50,200 |
| 2016 | $794 | $53,700 | $2,900 | $50,800 |
| 2015 | $602 | $53,700 | $2,900 | $50,800 |
| 2014 | $642 | $56,900 | $3,500 | $53,400 |
| 2013 | $602 | $56,900 | $3,500 | $53,400 |
Source: Public Records
Map
Nearby Homes