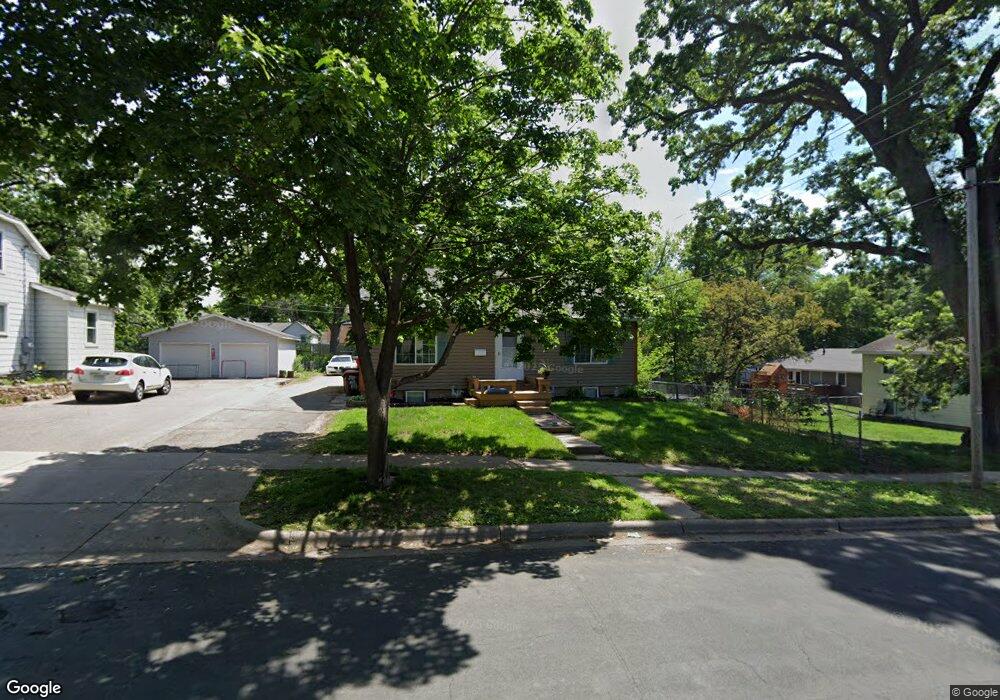
409 Pine St Hastings, MN 55033
Hastings-Marshan Township NeighborhoodEstimated Value: $261,541 - $286,000
4
Beds
1
Bath
864
Sq Ft
$313/Sq Ft
Est. Value
About This Home
This home is located at 409 Pine St, Hastings, MN 55033 and is currently estimated at $270,135, approximately $312 per square foot. 409 Pine St is a home located in Dakota County with nearby schools including Hastings Middle School, Christa Mcauliffe Elementary School, and Hastings High School.
Ownership History
Date
Name
Owned For
Owner Type
Purchase Details
Closed on
Apr 23, 2004
Sold by
Macheska Michael
Bought by
Teigen Renee
Current Estimated Value
Purchase Details
Closed on
Sep 17, 2001
Sold by
Dakota Mtg Corp Profit Sharing Plan & Tr
Bought by
Kylander Keith E and Kylander Stephanie L
Purchase Details
Closed on
Mar 31, 1997
Sold by
Marsh Ray D
Bought by
Gustafson Donald W and Gustafson Cory J
Create a Home Valuation Report for This Property
The Home Valuation Report is an in-depth analysis detailing your home's value as well as a comparison with similar homes in the area
Home Values in the Area
Average Home Value in this Area
Purchase History
| Date | Buyer | Sale Price | Title Company |
|---|---|---|---|
| Teigen Renee | $127,500 | -- | |
| Kylander Keith E | $87,900 | -- | |
| Macheska Michael | $135,000 | -- | |
| Gustafson Donald W | $87,900 | -- | |
| Kylander Keith E | $87,900 | -- |
Source: Public Records
Mortgage History
| Date | Status | Borrower | Loan Amount |
|---|---|---|---|
| Closed | Kylander Keith E | -- |
Source: Public Records
Tax History Compared to Growth
Tax History
| Year | Tax Paid | Tax Assessment Tax Assessment Total Assessment is a certain percentage of the fair market value that is determined by local assessors to be the total taxable value of land and additions on the property. | Land | Improvement |
|---|---|---|---|---|
| 2024 | $2,470 | $215,300 | $59,500 | $155,800 |
| 2023 | $2,470 | $213,800 | $59,600 | $154,200 |
| 2022 | $2,078 | $220,600 | $59,500 | $161,100 |
| 2021 | $1,980 | $168,700 | $51,700 | $117,000 |
| 2020 | $2,080 | $159,600 | $49,300 | $110,300 |
| 2019 | $2,026 | $162,100 | $46,900 | $115,200 |
| 2018 | $1,885 | $149,800 | $44,700 | $105,100 |
| 2017 | $1,441 | $134,600 | $42,600 | $92,000 |
| 2016 | $1,536 | $123,900 | $39,800 | $84,100 |
| 2015 | $1,522 | $101,735 | $30,800 | $70,935 |
| 2014 | -- | $101,408 | $29,657 | $71,751 |
| 2013 | -- | $82,660 | $25,249 | $57,411 |
Source: Public Records
Map
Nearby Homes