Estimated Value: $87,265 - $145,000
Studio
1
Bath
1,195
Sq Ft
$92/Sq Ft
Est. Value
About This Home
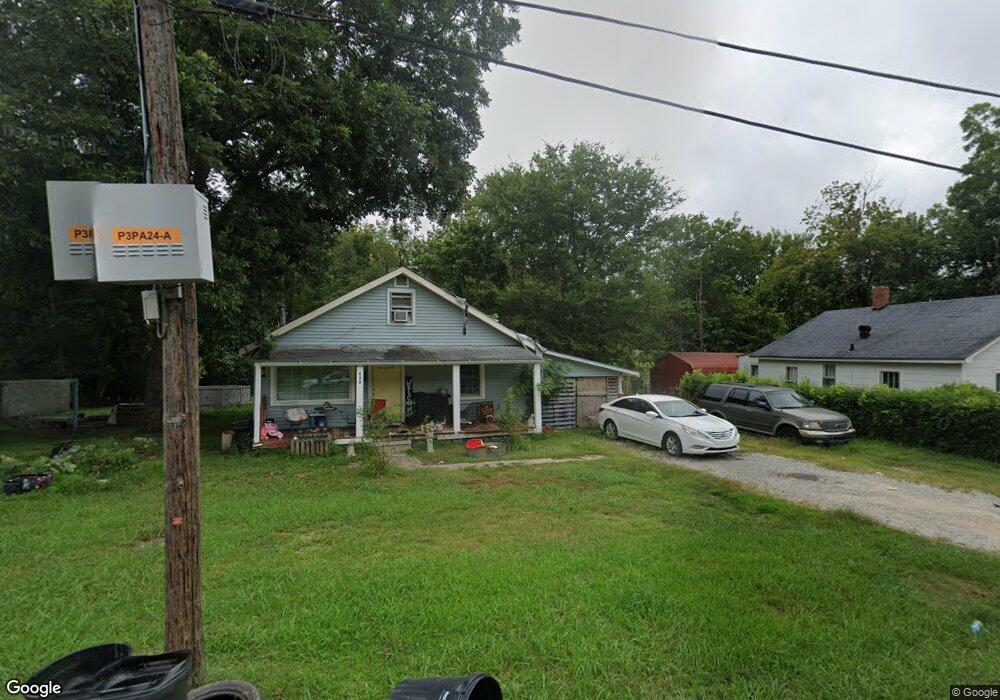
This home is located at 409 Powell St, Paris, TN 38242 and is currently estimated at $109,816, approximately $91 per square foot. 409 Powell St is a home located in Henry County with nearby schools including W.G. Rhea Elementary School, Paris Elementary School, and W.O. Inman Middle School.
Ownership History
Date
Name
Owned For
Owner Type
Purchase Details
Closed on
Aug 4, 2015
Sold by
Tharpe Fred
Bought by
Hoofman Tayra
Current Estimated Value
Purchase Details
Closed on
Jul 13, 2000
Sold by
Troy Woodruff
Bought by
Fred Tharpe
Purchase Details
Closed on
Jul 12, 2000
Bought by
Tharpe Fred
Purchase Details
Closed on
Sep 12, 1997
Sold by
Security Bank & Trust Co
Bought by
Troy Woodruff
Purchase Details
Closed on
Nov 26, 1996
Sold by
Lindley Edward F
Bought by
Security Bank And Trust
Purchase Details
Closed on
Dec 14, 1993
Bought by
Lindley Edward F
Purchase Details
Closed on
Jan 31, 1992
Bought by
Lindley Edward F and Lindley Sandra M
Purchase Details
Closed on
May 13, 1991
Bought by
Prentiss Edward Charles
Purchase Details
Closed on
Aug 24, 1987
Bought by
Tate Garrett and Tate Inez B
Purchase Details
Closed on
Oct 2, 1984
Bought by
Carter Jesse R and Carter Helen
Create a Home Valuation Report for This Property
The Home Valuation Report is an in-depth analysis detailing your home's value as well as a comparison with similar homes in the area
Home Values in the Area
Average Home Value in this Area
Purchase History
| Date | Buyer | Sale Price | Title Company |
|---|---|---|---|
| Hoofman Tayra | -- | -- | |
| Fred Tharpe | $39,825 | -- | |
| Tharpe Fred | $39,800 | -- | |
| Troy Woodruff | $15,000 | -- | |
| Security Bank And Trust | $13,887 | -- | |
| Lindley Edward F | -- | -- | |
| Lindley Edward F | $11,000 | -- | |
| Prentiss Edward Charles | $24,000 | -- | |
| Tate Garrett | -- | -- | |
| Carter Jesse R | -- | -- |
Source: Public Records
Tax History
| Year | Tax Paid | Tax Assessment Tax Assessment Total Assessment is a certain percentage of the fair market value that is determined by local assessors to be the total taxable value of land and additions on the property. | Land | Improvement |
|---|---|---|---|---|
| 2025 | $404 | $19,375 | $1,750 | $17,625 |
| 2024 | $364 | $10,900 | $1,125 | $9,775 |
| 2023 | $359 | $10,900 | $1,125 | $9,775 |
| 2022 | $261 | $10,900 | $1,125 | $9,775 |
| 2021 | $348 | $10,900 | $1,125 | $9,775 |
| 2020 | $339 | $10,900 | $1,125 | $9,775 |
| 2019 | $319 | $9,300 | $1,125 | $8,175 |
| 2018 | $355 | $10,500 | $1,125 | $9,375 |
| 2017 | $355 | $10,500 | $1,125 | $9,375 |
| 2016 | $341 | $10,500 | $1,125 | $9,375 |
| 2015 | $355 | $10,500 | $1,125 | $9,375 |
| 2014 | $310 | $10,500 | $1,125 | $9,375 |
| 2013 | $310 | $9,095 | $0 | $0 |
Source: Public Records
Map
Nearby Homes
- 0 Powell St
- 818 Curtis St
- 903 Curtis St
- 727 Powell St
- 1004 Curtis St
- 813 Curtis St
- 4 lots W Wood & Gwen St
- 711 Gwen St
- 00 Park
- 305 Greenacres Dr
- 111 Marilyn St
- 1203 Brentwood St
- 1112 Bridgette St
- 207 S Highland St
- 308 Sandra St
- 1401 Chickasaw Rd
- 0 N Brewer St
- 505 Walnut St
- 317 Aden St
- 1403 Lone Oak Rd
- 407 Powell St
- 411 Powell St
- 403 Powell St
- 412 Powell St
- 413 Powell St
- 410 Powell St
- 414 Powell St
- 904 Curtis St
- 902 Curtis St
- 906 Curtis St
- 908 Curtis St
- 416 Powell St
- 1 ACRE Powell St Unit Jones 1 acre Powell
- Powell Str Henry County
- 828 Lois St
- 826 Lois St
- 910 Curtis St
- 417 Powell St
- 824 Lois St
- 313 Powell St
Your Personal Tour Guide
Ask me questions while you tour the home.