Estimated Value: $845,000 - $890,000
5
Beds
4
Baths
5,146
Sq Ft
$170/Sq Ft
Est. Value
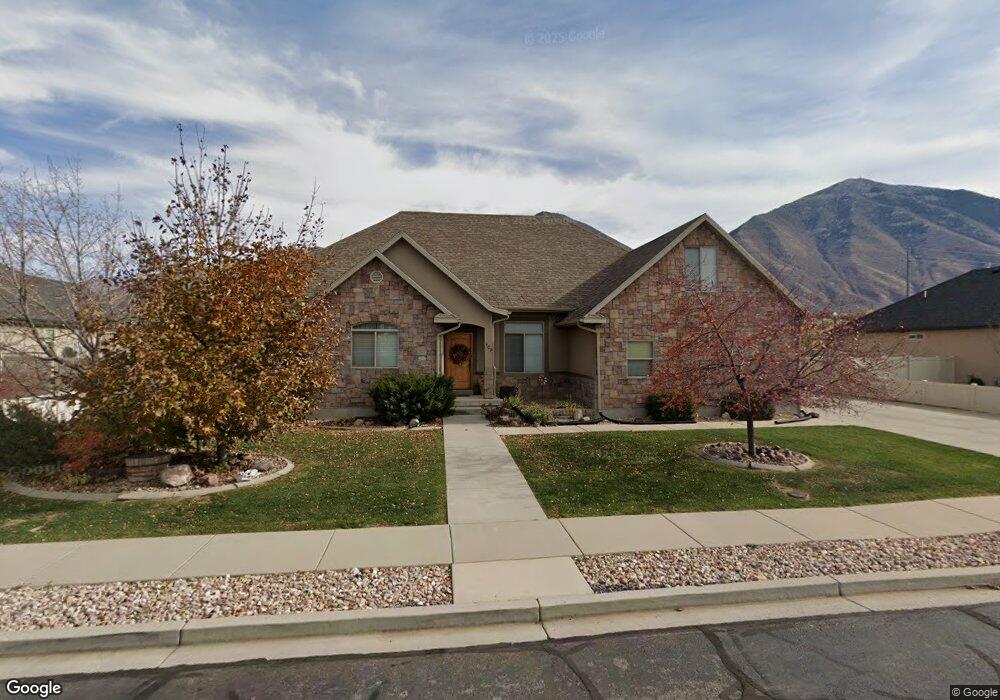
About This Home
This home is located at 409 S 930 E, Salem, UT 84653 and is currently estimated at $874,810, approximately $169 per square foot. 409 S 930 E is a home located in Utah County with nearby schools including Foothills Elementary School, Valley View Middle School, and Salem Junior High School.
Ownership History
Date
Name
Owned For
Owner Type
Purchase Details
Closed on
Jun 23, 2016
Sold by
Ripple Todd and Ripple Marilyn
Bought by
Ripple Todd and Ripple Brodee
Current Estimated Value
Purchase Details
Closed on
May 8, 2014
Sold by
Anderson Sheldon P and Anderson Julie
Bought by
Ripple Todd and Ripple Marilyn
Purchase Details
Closed on
May 28, 2008
Sold by
Blue Ledge Construction Inc and Southam Paul R
Bought by
Anderson Sheldon P and Anderson Julie
Home Financials for this Owner
Home Financials are based on the most recent Mortgage that was taken out on this home.
Original Mortgage
$290,000
Interest Rate
6.05%
Mortgage Type
Purchase Money Mortgage
Purchase Details
Closed on
Sep 7, 2006
Sold by
English Land Inc
Bought by
Riggs Joseph
Home Financials for this Owner
Home Financials are based on the most recent Mortgage that was taken out on this home.
Original Mortgage
$99,000
Interest Rate
6.67%
Mortgage Type
Balloon
Create a Home Valuation Report for This Property
The Home Valuation Report is an in-depth analysis detailing your home's value as well as a comparison with similar homes in the area
Home Values in the Area
Average Home Value in this Area
Purchase History
| Date | Buyer | Sale Price | Title Company |
|---|---|---|---|
| Ripple Todd | -- | None Available | |
| Ripple Todd | -- | Acccess Title Co | |
| Anderson Sheldon P | -- | Gt Title Services Spanish | |
| Riggs Joseph | -- | Provo Land Title Company |
Source: Public Records
Mortgage History
| Date | Status | Borrower | Loan Amount |
|---|---|---|---|
| Previous Owner | Anderson Sheldon P | $290,000 | |
| Previous Owner | Riggs Joseph | $99,000 |
Source: Public Records
Tax History
| Year | Tax Paid | Tax Assessment Tax Assessment Total Assessment is a certain percentage of the fair market value that is determined by local assessors to be the total taxable value of land and additions on the property. | Land | Improvement |
|---|---|---|---|---|
| 2025 | $3,733 | $437,470 | -- | -- |
| 2024 | $3,733 | $378,565 | $0 | $0 |
| 2023 | $3,653 | $371,085 | $0 | $0 |
| 2022 | $4,072 | $407,275 | $0 | $0 |
| 2021 | $3,228 | $518,100 | $125,000 | $393,100 |
| 2020 | $3,195 | $499,000 | $113,600 | $385,400 |
| 2019 | $2,918 | $465,400 | $104,900 | $360,500 |
| 2018 | $3,053 | $465,400 | $104,900 | $360,500 |
| 2017 | $2,723 | $221,375 | $0 | $0 |
| 2016 | $2,435 | $195,690 | $0 | $0 |
| 2015 | $2,429 | $191,730 | $0 | $0 |
| 2014 | $2,370 | $187,330 | $0 | $0 |
Source: Public Records
Map
Nearby Homes
- 1026 E 310 S
- 1003 E 310 S Unit 11
- 1036 E 310 S
- 1018 E 250 S
- 1034 E 250 S
- 1001 E 250 S
- 1033 E 250 S
- 173 E 10000 S
- 9800 Woodland Hills Dr
- 180 Woodland Hills Dr
- 88 S 850 E
- 881 E 820 S
- 1939 E Dorset Way Unit 306
- 1965 E Dorset Way Unit 303
- 1558 E 1010 N Unit 203
- 1984 E Dorset Way Unit 279
- 1802 E Albion Dr Unit 1142
- 1962 E Dorset Way Unit 276
- 1968 E Dorset Way Unit 277
- 6 Shady Ln
- 409 S 930 E Unit 42
- 427 S 930 E Unit 43
- 393 S 930 E Unit 41
- 917 E 430 S
- 917 E 430 S Unit 48
- 918 E 380 S
- 918 E 380 S Unit 49
- 445 S 930 E Unit 44
- 445 S 930 E
- 935 E 380 S Unit 40
- 916 E 430 S Unit 45
- 916 E 430 S
- 903 E 430 S
- 902 E 380 S
- 902 E 380 S Unit 50
- 919 E 380 S
- 461 S 930 E
- 944 E 340 S
- 932 E 340 S
- 904 E 430 S Unit 46
Your Personal Tour Guide
Ask me questions while you tour the home.