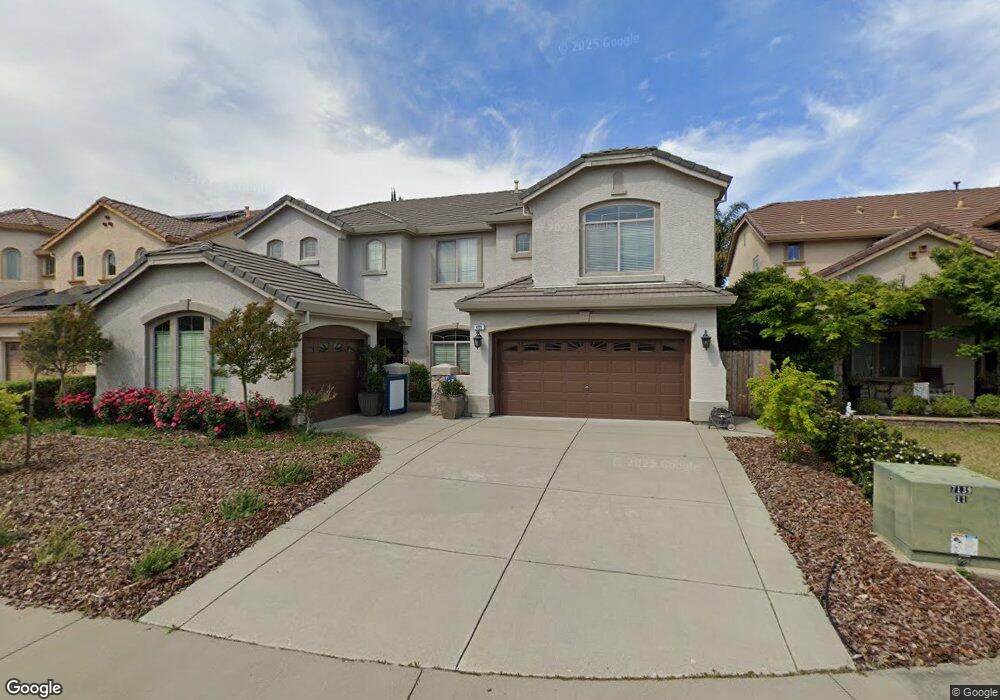
409 Sorrbento Ct Roseville, CA 95747
Blue Oaks NeighborhoodEstimated Value: $823,000 - $916,000
6
Beds
4
Baths
3,540
Sq Ft
$248/Sq Ft
Est. Value
About This Home
This home is located at 409 Sorrbento Ct, Roseville, CA 95747 and is currently estimated at $876,549, approximately $247 per square foot. 409 Sorrbento Ct is a home located in Placer County with nearby schools including Diamond Creek Elementary School, Robert C. Cooley Middle School, and Roseville High School.
Ownership History
Date
Name
Owned For
Owner Type
Purchase Details
Closed on
Jan 21, 2009
Sold by
American Home Mortgage Servicing Inc
Bought by
Nguyen Nam V
Current Estimated Value
Home Financials for this Owner
Home Financials are based on the most recent Mortgage that was taken out on this home.
Original Mortgage
$373,400
Outstanding Balance
$232,596
Interest Rate
4.91%
Mortgage Type
Unknown
Estimated Equity
$643,953
Purchase Details
Closed on
Oct 28, 2008
Sold by
Paulson Jeffrey and Paulson Kelly
Bought by
American Home Mortgage Servicing Inc
Purchase Details
Closed on
Jul 24, 2006
Sold by
Galli Luisa M
Bought by
Paulson Jeffrey and Paulson Kelly
Home Financials for this Owner
Home Financials are based on the most recent Mortgage that was taken out on this home.
Original Mortgage
$519,800
Interest Rate
7.5%
Mortgage Type
Unknown
Purchase Details
Closed on
Mar 22, 2005
Sold by
John Mourier Construction Inc
Bought by
Galli Luisa M
Create a Home Valuation Report for This Property
The Home Valuation Report is an in-depth analysis detailing your home's value as well as a comparison with similar homes in the area
Home Values in the Area
Average Home Value in this Area
Purchase History
| Date | Buyer | Sale Price | Title Company |
|---|---|---|---|
| Nguyen Nam V | $415,000 | Chicago Title Insurance Co | |
| American Home Mortgage Servicing Inc | $591,300 | None Available | |
| Paulson Jeffrey | $650,000 | Financial Title Company | |
| Galli Luisa M | $700,000 | Old Republic Title |
Source: Public Records
Mortgage History
| Date | Status | Borrower | Loan Amount |
|---|---|---|---|
| Open | Nguyen Nam V | $373,400 | |
| Previous Owner | Paulson Jeffrey | $519,800 |
Source: Public Records
Tax History Compared to Growth
Tax History
| Year | Tax Paid | Tax Assessment Tax Assessment Total Assessment is a certain percentage of the fair market value that is determined by local assessors to be the total taxable value of land and additions on the property. | Land | Improvement |
|---|---|---|---|---|
| 2025 | $7,525 | $570,643 | $103,012 | $467,631 |
| 2023 | $7,525 | $548,486 | $99,013 | $449,473 |
| 2022 | $7,414 | $537,732 | $97,072 | $440,660 |
| 2021 | $7,282 | $527,189 | $95,169 | $432,020 |
| 2020 | $7,168 | $521,785 | $94,194 | $427,591 |
| 2019 | $7,102 | $511,555 | $92,348 | $419,207 |
| 2018 | $7,003 | $501,526 | $90,538 | $410,988 |
| 2017 | $6,974 | $491,693 | $88,763 | $402,930 |
| 2016 | $6,899 | $482,053 | $87,023 | $395,030 |
| 2015 | $6,798 | $474,813 | $85,716 | $389,097 |
| 2014 | $6,746 | $465,513 | $84,037 | $381,476 |
Source: Public Records
Map
Nearby Homes
- 1617 Baroness Way
- 1856 San Esteban Cir
- 1680 Baroness Way
- 1656 San Esteban Cir
- 1249 Volonne Dr
- 1377 Volonne Dr
- 1393 Volonne Dr
- 232 Baroness Ct
- 3277 Mount Tamalpais Dr
- 1756 Terracina Cir
- 2548 Tradewinds Dr
- 108 Palomares Ct
- 1017 Volonne Dr
- 1757 Alicante Dr
- 1745 Marseille Ln
- 1625 Marseille Ln
- 1656 Marseille Ln
- 1529 Marseille Ln
- 1250 Plan at Glenfield at Placer One
- 1249 Plan at Glenfield at Placer One
- 401 Sorrbento Ct
- 417 Sorrbento Ct
- 508 Castillian Ct
- 500 Castillian Ct
- 516 Castillian Ct
- 425 Sorrbento Ct
- 408 Sorrbento Ct
- 524 Castillian Ct
- 400 Sorrbento Ct
- 416 Sorrbento Ct
- 1783 Camarena Way
- 1775 Camarena Way
- 532 Castillian Ct
- 600 Aliso Viejo Ct
- 424 Sorrbento Ct
- 1767 Camarena Way
- 1759 Camarena Way
- 509 Castillian Ct
- 308 Marbrisa Ct
- 300 Marbrisa Ct Unit 10