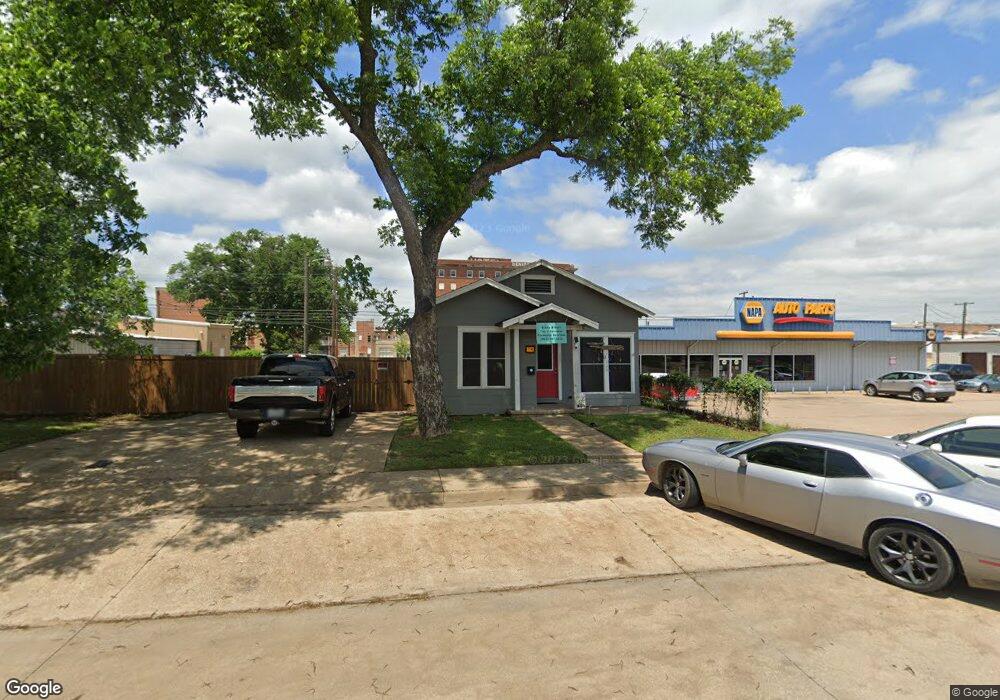
409 W Crawford St Denison, TX 75020
Downtown Denison Neighborhood
--
Bed
--
Bath
898
Sq Ft
8,712
Sq Ft Lot
About This Home
This home is located at 409 W Crawford St, Denison, TX 75020. 409 W Crawford St is a home located in Grayson County with nearby schools including Terrell Elementary School, Scott Middle School, and Denison High School.
Ownership History
Date
Name
Owned For
Owner Type
Purchase Details
Closed on
Apr 24, 2019
Sold by
Dorris Laramie L and Dorris Brooke K
Bought by
Los Hermanos Partnership Llc
Home Financials for this Owner
Home Financials are based on the most recent Mortgage that was taken out on this home.
Original Mortgage
$66,980
Outstanding Balance
$58,887
Interest Rate
4.3%
Mortgage Type
Commercial
Purchase Details
Closed on
Dec 30, 2014
Sold by
Parvez Armd and Parvez Sharmeen
Bought by
Guymon Greg
Home Financials for this Owner
Home Financials are based on the most recent Mortgage that was taken out on this home.
Original Mortgage
$30,600
Interest Rate
4.01%
Mortgage Type
Commercial
Purchase Details
Closed on
May 26, 2009
Sold by
American General Financial Services Inc
Bought by
Parvez Armd and Parvez Sharmeen
Purchase Details
Closed on
Jul 12, 2007
Sold by
Morales James
Bought by
American General Financial Services Inc
Purchase Details
Closed on
Jan 19, 2006
Sold by
Morales James
Bought by
Morales Acquisitions Ltd
Create a Home Valuation Report for This Property
The Home Valuation Report is an in-depth analysis detailing your home's value as well as a comparison with similar homes in the area
Home Values in the Area
Average Home Value in this Area
Purchase History
| Date | Buyer | Sale Price | Title Company |
|---|---|---|---|
| Los Hermanos Partnership Llc | -- | Red River Title Co | |
| Guymon Greg | -- | Grayson County Title | |
| Parvez Armd | -- | Chapin Title Co Inc | |
| American General Financial Services Inc | $60,000 | None Available | |
| Morales Acquisitions Ltd | -- | None Available |
Source: Public Records
Mortgage History
| Date | Status | Borrower | Loan Amount |
|---|---|---|---|
| Open | Los Hermanos Partnership Llc | $66,980 | |
| Previous Owner | Guymon Greg | $30,600 |
Source: Public Records
Tax History Compared to Growth
Tax History
| Year | Tax Paid | Tax Assessment Tax Assessment Total Assessment is a certain percentage of the fair market value that is determined by local assessors to be the total taxable value of land and additions on the property. | Land | Improvement |
|---|---|---|---|---|
| 2025 | $2,959 | $179,186 | $109,800 | $69,386 |
| 2024 | $2,959 | $127,364 | $0 | $0 |
| 2023 | $2,405 | $106,137 | $51,300 | $54,837 |
| 2022 | $2,063 | $86,836 | $51,300 | $35,536 |
| 2021 | $2,190 | $86,836 | $49,950 | $36,886 |
| 2020 | $2,263 | $85,809 | $49,950 | $35,859 |
| 2019 | $1,950 | $70,872 | $22,500 | $48,372 |
| 2018 | $1,998 | $72,037 | $18,900 | $53,137 |
| 2017 | $1,346 | $48,127 | $9,450 | $38,677 |
| 2016 | $657 | $23,489 | $9,450 | $14,039 |
| 2015 | $763 | $27,026 | $9,450 | $17,576 |
| 2014 | $763 | $27,026 | $9,450 | $17,576 |
Source: Public Records
Map
Nearby Homes
- 330 W Morgan St
- 506 W Woodard St
- 609 W Owing St
- 618 W Chestnut St
- 627 W Chestnut St
- 705 W Crawford St
- 615 W Gandy St
- 720 W Gandy St
- 408 W Day St
- 702 S Barrett Ave
- 607 W Sears St
- 826 W Crawford St
- 326 W Day St
- 831 W Owing St
- 811 W Woodard St
- TBD W Main St
- 117 W Sears St
- 200 E Morgan St
- 511 W Munson St
- 716 N Rusk Ave
- 400 W Chestnut St
- 201 S Burnett Ave
- 202 S Burnett Ave
- 324 W Chestnut St
- 320 W Chestnut St
- 321 A W Crawford St
- 321 W Crawford St
- 319 W Crawford St
- 318 W Chestnut St
- 317 W Crawford St
- 317 W Crawford St Unit F
- 317 W Crawford St Unit C
- 500 W Chestnut St
- 316 W Chestnut St
- 301 S Fannin Ave
- 500 W Crawford St
- 309 S Fannin Ave
- 505 W Crawford St
- 508 W Crawford St
- 414 W Main St