Estimated Value: $160,000 - $188,804
3
Beds
1
Bath
1,414
Sq Ft
$125/Sq Ft
Est. Value
About This Home
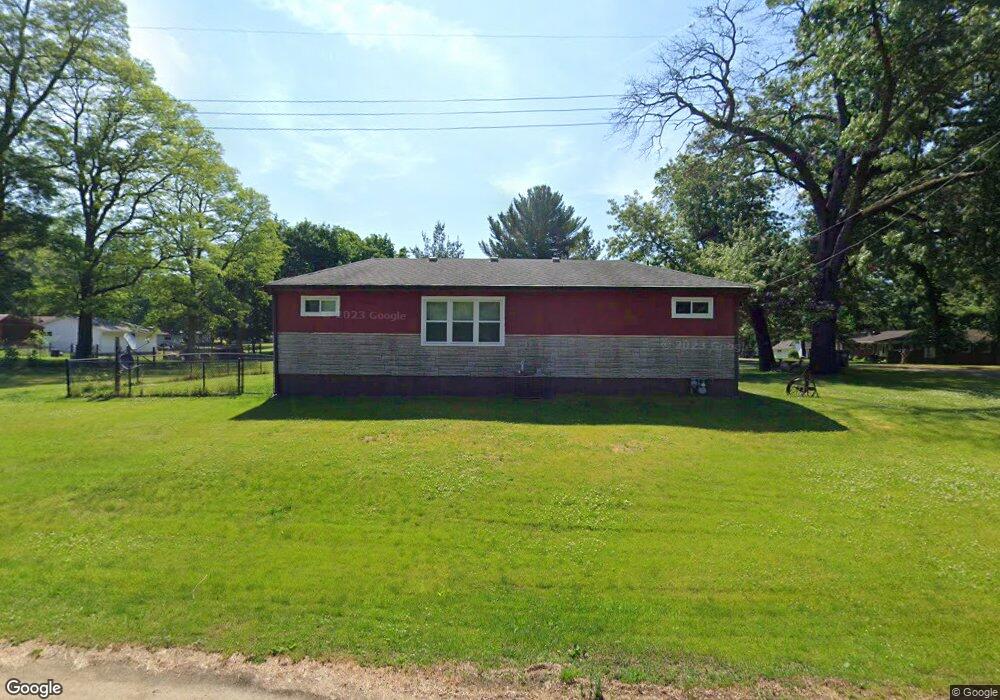
This home is located at 4092 W Ogle St, Dixon, IL 61021 and is currently estimated at $177,451, approximately $125 per square foot. 4092 W Ogle St is a home located in Ogle County with nearby schools including Washington Elementary School, Madison Elementary School, and Jefferson Elementary School.
Ownership History
Date
Name
Owned For
Owner Type
Purchase Details
Closed on
Nov 16, 2007
Sold by
Flickinger Michael J
Bought by
Hitchcock Willam A and Hitchcock Glenda L
Current Estimated Value
Home Financials for this Owner
Home Financials are based on the most recent Mortgage that was taken out on this home.
Original Mortgage
$74,400
Outstanding Balance
$47,243
Interest Rate
6.45%
Mortgage Type
New Conventional
Estimated Equity
$130,208
Purchase Details
Closed on
May 21, 2007
Sold by
Federal Home Loan Mortgage Corporation
Bought by
Flickinger Michael J
Purchase Details
Closed on
Mar 23, 2007
Sold by
Postlewaite Jacalyn and Postlewaite Jacalyn K
Bought by
Amecore Bank Na
Purchase Details
Closed on
Mar 1, 2006
Sold by
Postlewaite James
Bought by
Postlewaite Jacalyn
Home Financials for this Owner
Home Financials are based on the most recent Mortgage that was taken out on this home.
Original Mortgage
$100,800
Interest Rate
6.37%
Mortgage Type
New Conventional
Create a Home Valuation Report for This Property
The Home Valuation Report is an in-depth analysis detailing your home's value as well as a comparison with similar homes in the area
Home Values in the Area
Average Home Value in this Area
Purchase History
| Date | Buyer | Sale Price | Title Company |
|---|---|---|---|
| Hitchcock Willam A | $93,500 | None Available | |
| Flickinger Michael J | -- | None Available | |
| Amecore Bank Na | $109,889 | None Available | |
| Postlewaite Jacalyn | -- | None Available |
Source: Public Records
Mortgage History
| Date | Status | Borrower | Loan Amount |
|---|---|---|---|
| Open | Hitchcock Willam A | $74,400 | |
| Previous Owner | Postlewaite Jacalyn | $100,800 |
Source: Public Records
Tax History Compared to Growth
Tax History
| Year | Tax Paid | Tax Assessment Tax Assessment Total Assessment is a certain percentage of the fair market value that is determined by local assessors to be the total taxable value of land and additions on the property. | Land | Improvement |
|---|---|---|---|---|
| 2024 | $3,152 | $52,549 | $9,220 | $43,329 |
| 2023 | $2,860 | $49,608 | $9,193 | $40,415 |
| 2022 | $2,591 | $45,392 | $8,412 | $36,980 |
| 2021 | $2,357 | $42,225 | $7,825 | $34,400 |
| 2020 | $2,256 | $40,326 | $7,473 | $32,853 |
| 2019 | $2,140 | $38,682 | $7,168 | $31,514 |
| 2018 | $2,010 | $37,284 | $6,909 | $30,375 |
| 2017 | $1,912 | $35,761 | $6,627 | $29,134 |
| 2016 | $1,859 | $35,009 | $6,488 | $28,521 |
| 2015 | $1,681 | $34,122 | $6,324 | $27,798 |
| 2014 | $1,726 | $34,122 | $6,324 | $27,798 |
| 2013 | $2,174 | $34,850 | $6,459 | $28,391 |
Source: Public Records
Map
Nearby Homes
- 8505 S Clinton St
- 4476 W Edgewood Rd
- 7198 S Rock Nation Rd
- 000 Bridlewood Cir
- 7961 S Tampam Dr
- Lot #74 and #75 Pond Ct
- 226 Platte Dr
- 210 Platte Dr
- 906 Monongahela Dr
- 401 Saint Francis Dr
- 415 Saint Francis Dr
- 626 Rolling Ln
- 609 Missouri Dr
- 711,713,715 Mississippi Dr
- 320 Vermillion Ln
- 844 Hann Ave
- 703 Kaskaskia Dr
- 703 Rock Ct
- 705 Rock Ct
- 214 Crabapple Ct
- 4044 W Ogle St
- 7969 Oak St
- 7984 Oak St
- 4063 W Ogle St
- 7945 Oak St
- 7956 Oak St
- 4087 W Ogle St
- 4013 W Ogle St
- 7980 S Pine St
- 7927 S Walnut St
- 7913 Oak St
- 8058 S Pine St
- 7926 S Pine St
- 4015 W Wisconsin St
- 4109 W Wisconsin St
- 7929 S Walnut St
- 8100 S Pine St
- 7909 S Pine St
- 3932 W Ogle St
- 4020 W Wisconsin St