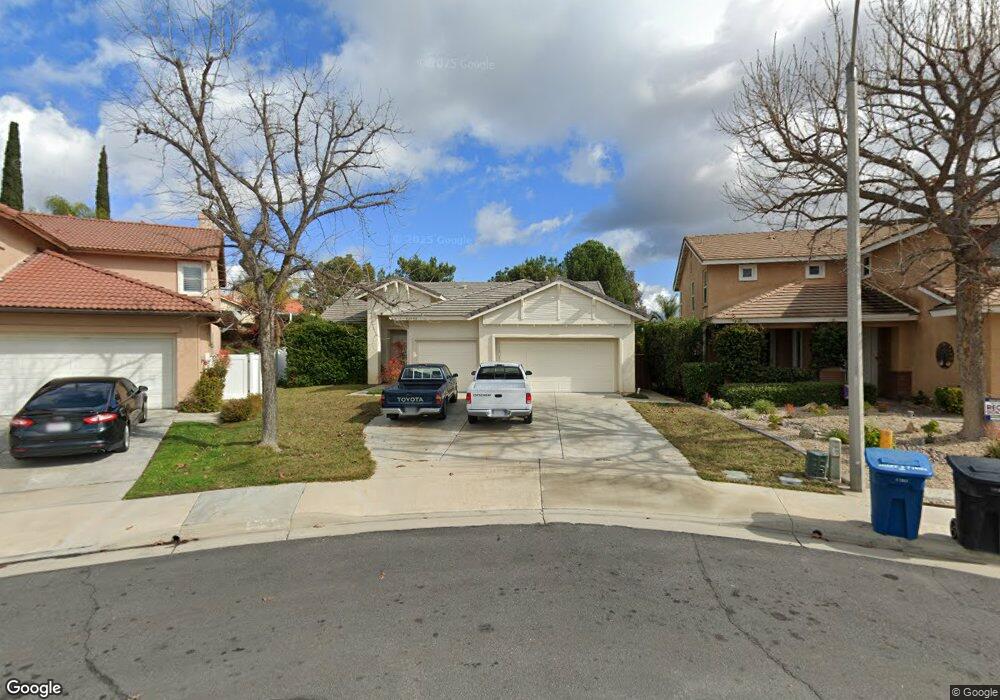
40955 Burgess Ct Temecula, CA 92591
Chardonnay Hills NeighborhoodEstimated Value: $721,506 - $870,000
4
Beds
2
Baths
2,284
Sq Ft
$338/Sq Ft
Est. Value
About This Home
This home is located at 40955 Burgess Ct, Temecula, CA 92591 and is currently estimated at $771,627, approximately $337 per square foot. 40955 Burgess Ct is a home located in Riverside County with nearby schools including Rancho Elementary School, Margarita Middle School, and Temecula Valley High School.
Ownership History
Date
Name
Owned For
Owner Type
Purchase Details
Closed on
Feb 13, 2009
Sold by
Beswick Steven
Bought by
Beswick Steven Wayne
Current Estimated Value
Home Financials for this Owner
Home Financials are based on the most recent Mortgage that was taken out on this home.
Original Mortgage
$171,850
Outstanding Balance
$107,107
Interest Rate
4.92%
Mortgage Type
New Conventional
Estimated Equity
$664,520
Purchase Details
Closed on
Jan 23, 2009
Sold by
Beswick Steven and Beswick Steven Wayne
Bought by
Beswick Steven
Home Financials for this Owner
Home Financials are based on the most recent Mortgage that was taken out on this home.
Original Mortgage
$171,850
Outstanding Balance
$107,107
Interest Rate
4.92%
Mortgage Type
New Conventional
Estimated Equity
$664,520
Purchase Details
Closed on
Jan 29, 2001
Sold by
Lennar Homes Of California Inc
Bought by
Beswick Steven Wayne
Home Financials for this Owner
Home Financials are based on the most recent Mortgage that was taken out on this home.
Original Mortgage
$241,300
Interest Rate
7.06%
Create a Home Valuation Report for This Property
The Home Valuation Report is an in-depth analysis detailing your home's value as well as a comparison with similar homes in the area
Home Values in the Area
Average Home Value in this Area
Purchase History
| Date | Buyer | Sale Price | Title Company |
|---|---|---|---|
| Beswick Steven Wayne | -- | Accommodation | |
| Beswick Steven | -- | Chicago Title Company | |
| Beswick Steven Wayne | $254,500 | North American Title Co |
Source: Public Records
Mortgage History
| Date | Status | Borrower | Loan Amount |
|---|---|---|---|
| Open | Beswick Steven | $171,850 | |
| Previous Owner | Beswick Steven Wayne | $241,300 |
Source: Public Records
Tax History
| Year | Tax Paid | Tax Assessment Tax Assessment Total Assessment is a certain percentage of the fair market value that is determined by local assessors to be the total taxable value of land and additions on the property. | Land | Improvement |
|---|---|---|---|---|
| 2025 | $4,482 | $383,463 | $67,793 | $315,670 |
| 2023 | $4,482 | $368,574 | $65,161 | $303,413 |
| 2022 | $4,338 | $361,348 | $63,884 | $297,464 |
| 2021 | $4,243 | $354,264 | $62,632 | $291,632 |
| 2020 | $4,195 | $350,632 | $61,990 | $288,642 |
| 2019 | $4,131 | $343,758 | $60,775 | $282,983 |
| 2018 | $4,046 | $337,019 | $59,584 | $277,435 |
| 2017 | $3,971 | $330,412 | $58,416 | $271,996 |
| 2016 | $3,893 | $323,934 | $57,271 | $266,663 |
| 2015 | $3,822 | $319,069 | $56,411 | $262,658 |
| 2014 | $3,703 | $312,821 | $55,307 | $257,514 |
Source: Public Records
Map
Nearby Homes
- 31425 Culbertson Ln
- 31492 Britton Cir
- 41087 Promenade Chardonnay Hills
- 0 Winchester Rd Unit IG26012987
- 0 Vista Del Monte Rd Unit SW24075540
- 40973 Cebu Dr
- 39502 S Fiesta Ranch Rd
- 39508 S Fiesta Ranch Rd
- 39514 S Fiesta Ranch Rd
- 32040 S Fiesta Ranch Rd
- 32130 Fiesta Ranch Rd S
- 32047 S Fiesta Ranch Rd
- 31461 Congressional Dr
- 31939 Calle Elenita
- 32191 Placer Belair
- 31345 Avenida Del Reposo
- 41657 Cypress Point Way
- 40601 Cebu St
- 41686 Monterey Place
- 41606 Slice Way
- 40960 Burgess Ct
- 40963 Burgess Ct
- 31499 Sonoma Ln
- 31491 Sonoma Ln
- 31507 Sonoma Ln
- 31483 Sonoma Ln
- 40971 Burgess Ct
- 31530 Culbertson Ln
- 31520 Culbertson Ln
- 40968 Burgess Ct
- 31540 Culbertson Ln
- 31510 Culbertson Ln
- 31475 Sonoma Ln
- 40979 Burgess Ct
- 31467 Sonoma Ln
- 31550 Culbertson Ln
- 40976 Burgess Ct
- 31490 Culbertson Ln
- 31459 Sonoma Ln
- 40987 Burgess Ct
Your Personal Tour Guide
Ask me questions while you tour the home.