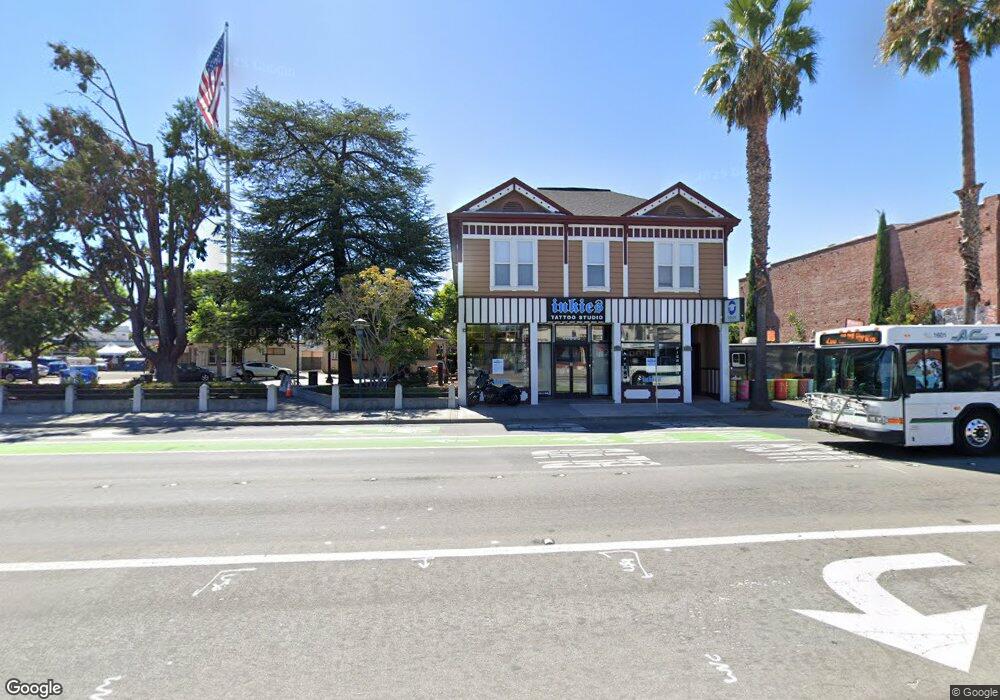
40985 Fremont Blvd Fremont, CA 94538
Irvington NeighborhoodEstimated Value: $1,750,664
--
Bed
--
Bath
5,505
Sq Ft
$318/Sq Ft
Est. Value
About This Home
This home is located at 40985 Fremont Blvd, Fremont, CA 94538 and is currently estimated at $1,750,664, approximately $318 per square foot. 40985 Fremont Blvd is a home located in Alameda County with nearby schools including O. N. Hirsch Elementary School, John M. Horner Junior High School, and Irvington High School.
Ownership History
Date
Name
Owned For
Owner Type
Purchase Details
Closed on
Feb 6, 2014
Sold by
Mirza Tariq
Bought by
Ml Investment Irvington Llc
Current Estimated Value
Purchase Details
Closed on
Mar 7, 2011
Sold by
Sa Challenger Inc
Bought by
Mirza Tariq
Home Financials for this Owner
Home Financials are based on the most recent Mortgage that was taken out on this home.
Original Mortgage
$445,000
Interest Rate
4.71%
Mortgage Type
Commercial
Purchase Details
Closed on
Jun 4, 2010
Sold by
Ciubancan Vasile and Ciubancan Viorica
Bought by
Sa Challenger Inc
Purchase Details
Closed on
Jan 20, 1995
Sold by
Ng Yui Cheong and Ng Shuet Yi
Bought by
Ciubancan Vasile and Ciubancan Viorica
Home Financials for this Owner
Home Financials are based on the most recent Mortgage that was taken out on this home.
Original Mortgage
$229,000
Interest Rate
9.28%
Mortgage Type
Commercial
Create a Home Valuation Report for This Property
The Home Valuation Report is an in-depth analysis detailing your home's value as well as a comparison with similar homes in the area
Home Values in the Area
Average Home Value in this Area
Purchase History
| Date | Buyer | Sale Price | Title Company |
|---|---|---|---|
| Ml Investment Irvington Llc | $1,335,000 | Old Republic Title Company | |
| Mirza Tariq | -- | None Available | |
| Sa Challenger Inc | $493,500 | None Available | |
| Ciubancan Vasile | $390,000 | Old Republic Title Company |
Source: Public Records
Mortgage History
| Date | Status | Borrower | Loan Amount |
|---|---|---|---|
| Previous Owner | Mirza Tariq | $445,000 | |
| Previous Owner | Ciubancan Vasile | $229,000 | |
| Closed | Ciubancan Vasile | $83,000 |
Source: Public Records
Tax History Compared to Growth
Tax History
| Year | Tax Paid | Tax Assessment Tax Assessment Total Assessment is a certain percentage of the fair market value that is determined by local assessors to be the total taxable value of land and additions on the property. | Land | Improvement |
|---|---|---|---|---|
| 2025 | $20,985 | $1,804,040 | $498,764 | $1,305,276 |
| 2024 | $20,985 | $1,768,680 | $488,988 | $1,279,692 |
| 2023 | $20,525 | $1,734,000 | $479,400 | $1,254,600 |
| 2022 | $18,585 | $1,542,085 | $288,780 | $1,253,305 |
| 2021 | $17,942 | $1,511,860 | $283,120 | $1,228,740 |
| 2020 | $18,229 | $1,496,360 | $280,217 | $1,216,143 |
| 2019 | $17,914 | $1,467,031 | $274,725 | $1,192,306 |
| 2018 | $17,570 | $1,438,275 | $269,340 | $1,168,935 |
| 2017 | $17,132 | $1,410,080 | $264,060 | $1,146,020 |
| 2016 | $16,859 | $1,382,432 | $258,882 | $1,123,550 |
| 2015 | $16,789 | $1,361,673 | $254,995 | $1,106,678 |
| 2014 | $8,304 | $569,590 | $156,768 | $412,822 |
Source: Public Records
Map
Nearby Homes
- 40769 Squill Common
- 41212 Fremont Blvd
- 40708 Fremont Blvd
- 4310 Providence Terrace
- 3331 Union St
- 3800 Adams Ave
- 4463 Hyde Common Unit 306
- 4214 Providence Terrace
- 3918 Fossano Common
- 40425 Chapel Way Unit 214
- 40425 Chapel Way Unit 309
- 40702 Greystone Terrace Unit 9
- 2851 Finca Terrace
- 2813 Pinnacles Terrace
- 41538 Casabella Common
- 3872 Wildflower Common Unit 27
- 3923 Wildflower Common Unit 19
- 40469 Shaw Ct
- 41620 Beatrice St
- 4350 Millard Ave
- 40979 Fremont Blvd
- 40967 Fremont Blvd
- 4000 Bay St
- 41025 Fremont Blvd
- 40919 Fremont Blvd Unit 12
- 40919 Fremont Blvd
- 41033 Fremont Blvd
- 3983 Washington Blvd
- 4080 Bay St
- 4071 Bay St
- 3961 Washington Blvd
- 4086 Bay St
- 3955 Washington Blvd
- 41049 Fremont Blvd
- 4096 Bay St
- 41067 Fremont Blvd
- 41063 Fremont Blvd
- 40966 Lee St
- 4127 Bay St
- 3897 Union St