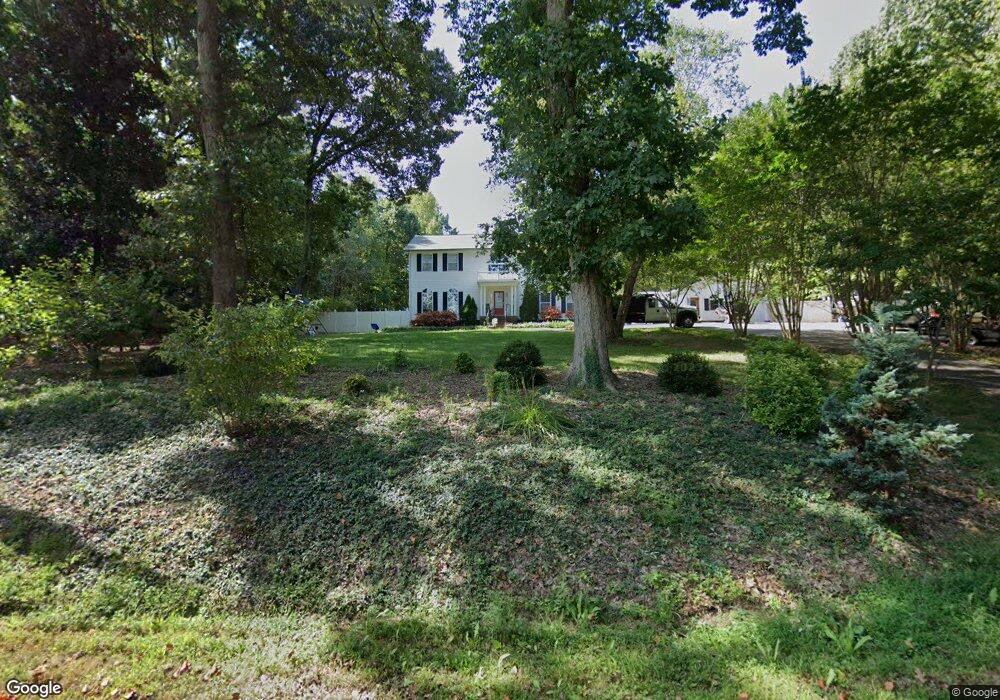
4099 Rhynland Dr Sherrills Ford, NC 28673
Estimated Value: $348,000 - $629,000
3
Beds
3
Baths
2,800
Sq Ft
$174/Sq Ft
Est. Value
About This Home
This home is located at 4099 Rhynland Dr, Sherrills Ford, NC 28673 and is currently estimated at $486,000, approximately $173 per square foot. 4099 Rhynland Dr is a home located in Catawba County with nearby schools including Bandys High School, Sherrills Ford Elementary School, and Mill Creek Middle School.
Ownership History
Date
Name
Owned For
Owner Type
Purchase Details
Closed on
Oct 2, 2017
Sold by
Hoover Amie Janelle
Bought by
Hoover Amie Jenelle and Hoover John B
Current Estimated Value
Home Financials for this Owner
Home Financials are based on the most recent Mortgage that was taken out on this home.
Original Mortgage
$222,000
Outstanding Balance
$185,233
Interest Rate
3.78%
Mortgage Type
New Conventional
Estimated Equity
$300,767
Purchase Details
Closed on
Mar 14, 2013
Sold by
Branch Banking & Trust Company
Bought by
Hoover Amie Janelle
Home Financials for this Owner
Home Financials are based on the most recent Mortgage that was taken out on this home.
Original Mortgage
$171,830
Interest Rate
3.37%
Mortgage Type
FHA
Purchase Details
Closed on
Apr 30, 2012
Sold by
Franz Sharon Lynne
Bought by
Branch Banking & Trust Company
Purchase Details
Closed on
Dec 20, 2002
Purchase Details
Closed on
Feb 2, 1999
Create a Home Valuation Report for This Property
The Home Valuation Report is an in-depth analysis detailing your home's value as well as a comparison with similar homes in the area
Home Values in the Area
Average Home Value in this Area
Purchase History
| Date | Buyer | Sale Price | Title Company |
|---|---|---|---|
| Hoover Amie Jenelle | -- | None Available | |
| Hoover Amie Janelle | $175,000 | None Available | |
| Branch Banking & Trust Company | $174,250 | None Available | |
| -- | $235,000 | -- | |
| -- | $15,000 | -- |
Source: Public Records
Mortgage History
| Date | Status | Borrower | Loan Amount |
|---|---|---|---|
| Open | Hoover Amie Jenelle | $222,000 | |
| Closed | Hoover Amie Janelle | $171,830 |
Source: Public Records
Tax History Compared to Growth
Tax History
| Year | Tax Paid | Tax Assessment Tax Assessment Total Assessment is a certain percentage of the fair market value that is determined by local assessors to be the total taxable value of land and additions on the property. | Land | Improvement |
|---|---|---|---|---|
| 2025 | $1,902 | $386,200 | $34,900 | $351,300 |
| 2024 | $1,902 | $386,200 | $34,900 | $351,300 |
| 2023 | $1,863 | $220,100 | $31,200 | $188,900 |
| 2022 | $1,552 | $220,100 | $31,200 | $188,900 |
| 2021 | $1,552 | $220,100 | $31,200 | $188,900 |
| 2020 | $1,552 | $220,100 | $31,200 | $188,900 |
| 2019 | $1,552 | $220,100 | $0 | $0 |
| 2018 | $1,549 | $226,100 | $31,000 | $195,100 |
| 2017 | $1,549 | $0 | $0 | $0 |
| 2016 | $1,549 | $0 | $0 | $0 |
| 2015 | $1,417 | $226,100 | $31,000 | $195,100 |
| 2014 | $1,417 | $236,100 | $31,800 | $204,300 |
Source: Public Records
Map
Nearby Homes
- 4159 Todd St
- 3915 Chevlot Hills Rd
- 4278 Harbor Ln
- 6997 Waterstone Dr
- 3861 Swanson Rd
- 3930 Norman View Dr
- 4155 Slanting Bridge Rd
- 0 Chevlot Hills Rd
- 939 Exeter Dr
- 916 Exeter Dr
- 7869 Iron Rd
- 7950 Mocassin Dr
- 7882 Iron Rd
- 4364 Bronze Blvd
- 4366 Bronze Blvd
- 4372 Bronze Blvd
- 4251 Slanting Bridge Rd
- 4121 Steel Way
- 3835 Norman View Dr
- 4153 Steel Way
- 4141 Rhynland Dr
- 4082 Rhynland Dr
- 4001 Rhynland Dr
- 7644 Kilkee Ln
- 3983 Rhynland Dr
- 7622 Kilkee Ln
- 7448 E Nc 150 Hwy
- 7634 Kilkee Ln
- 4075 Chevlot Hills Rd Unit 7
- 4066 Rhynland Dr
- 4062 Rhynland Dr
- 4053 Chevlot Hills Rd
- 7414 E Nc 150 Hwy
- 3996 Rhynland Dr
- 4056 Rhynland Dr
- 4010 Rhynland Dr
- 3978 Rhynland Dr
- 4108 Chevlot Hills Rd
- 4036 Rhynland Dr