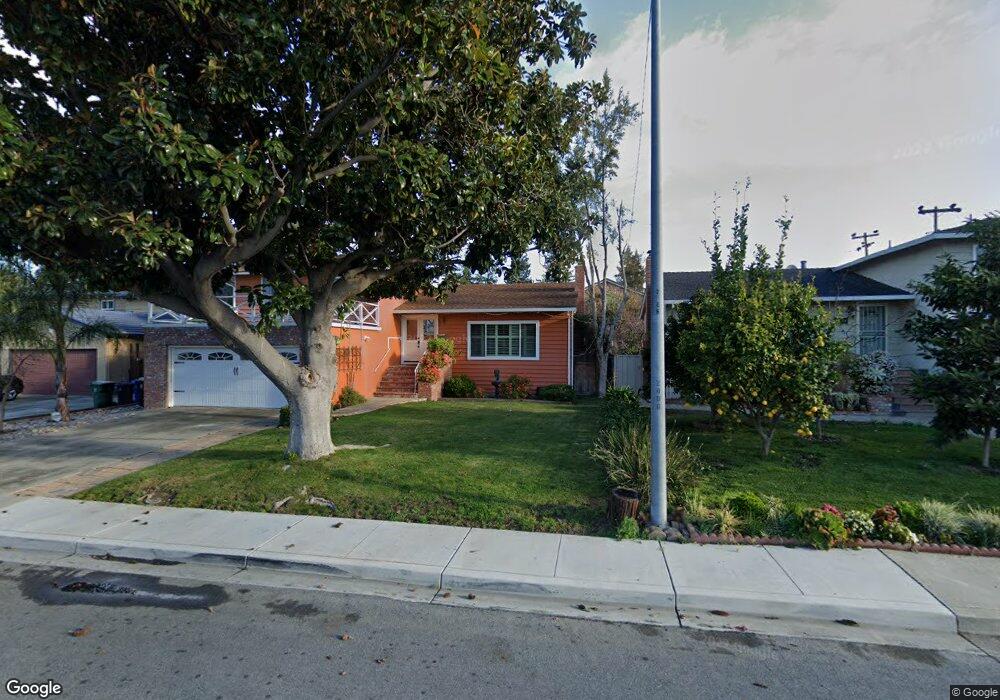
4099 Tawny Terrace Unit 9 Fremont, CA 94536
Estimated Value: $999,000 - $1,208,000
2
Beds
3
Baths
1,390
Sq Ft
$771/Sq Ft
Est. Value
About This Home
This home is located at 4099 Tawny Terrace Unit 9, Fremont, CA 94536 and is currently estimated at $1,071,353, approximately $770 per square foot. 4099 Tawny Terrace Unit 9 is a home located in Alameda County with nearby schools including Oliveira Elementary School, Thornton Middle School, and American High School.
Ownership History
Date
Name
Owned For
Owner Type
Purchase Details
Closed on
Nov 14, 2017
Sold by
Mcintosh Roberta Irene
Bought by
Halder Achintya and Halder Soma
Current Estimated Value
Home Financials for this Owner
Home Financials are based on the most recent Mortgage that was taken out on this home.
Original Mortgage
$600,000
Outstanding Balance
$496,257
Interest Rate
3.37%
Mortgage Type
Adjustable Rate Mortgage/ARM
Estimated Equity
$575,096
Purchase Details
Closed on
Sep 16, 2016
Sold by
Torres Roberta 1
Bought by
Mcintosh Roberta Irene
Purchase Details
Closed on
Sep 17, 2009
Sold by
Torres Roberta I
Bought by
Torres Roberta I
Purchase Details
Closed on
Apr 19, 1995
Sold by
Patco Enterprises
Bought by
Torres Roberta I
Home Financials for this Owner
Home Financials are based on the most recent Mortgage that was taken out on this home.
Original Mortgage
$149,600
Interest Rate
8.44%
Mortgage Type
Purchase Money Mortgage
Create a Home Valuation Report for This Property
The Home Valuation Report is an in-depth analysis detailing your home's value as well as a comparison with similar homes in the area
Home Values in the Area
Average Home Value in this Area
Purchase History
| Date | Buyer | Sale Price | Title Company |
|---|---|---|---|
| Halder Achintya | $816,000 | Chicago Title Company | |
| Mcintosh Roberta Irene | -- | None Available | |
| Torres Roberta I | -- | None Available | |
| Torres Roberta I | $187,000 | Chicago Title Company |
Source: Public Records
Mortgage History
| Date | Status | Borrower | Loan Amount |
|---|---|---|---|
| Open | Halder Achintya | $600,000 | |
| Previous Owner | Torres Roberta I | $149,600 |
Source: Public Records
Tax History Compared to Growth
Tax History
| Year | Tax Paid | Tax Assessment Tax Assessment Total Assessment is a certain percentage of the fair market value that is determined by local assessors to be the total taxable value of land and additions on the property. | Land | Improvement |
|---|---|---|---|---|
| 2025 | $10,951 | $921,452 | $278,535 | $649,917 |
| 2024 | $10,951 | $903,247 | $273,074 | $637,173 |
| 2023 | $10,661 | $892,401 | $267,720 | $624,681 |
| 2022 | $10,529 | $867,906 | $262,472 | $612,434 |
| 2021 | $10,274 | $850,754 | $257,326 | $600,428 |
| 2020 | $10,314 | $848,965 | $254,689 | $594,276 |
| 2019 | $10,194 | $832,320 | $249,696 | $582,624 |
| 2018 | $9,995 | $816,000 | $244,800 | $571,200 |
| 2017 | $3,582 | $270,633 | $81,045 | $189,588 |
| 2016 | $3,510 | $265,327 | $79,456 | $185,871 |
| 2015 | $3,451 | $261,343 | $78,263 | $183,080 |
| 2014 | $3,391 | $256,224 | $76,730 | $179,494 |
Source: Public Records
Map
Nearby Homes
- 4412 Elaiso Common
- 4251 Nicolet Ave
- 4543 Bartolo Terrace
- 36922 Bolina Terrace
- 37001 Contra Costa Ave
- 4632 Balboa Way
- 36304 Magellan Dr
- 4544 Thornton Ave
- 3663 Oakwood Terrace Unit 211
- 35624 Mccarty Common
- 36347 Magellan Dr
- 3530 Oakwood Terrace Unit 102
- 36992 Meadowbrook Common Unit 102
- 3371 Baywood Terrace Unit 214
- 4626 Alhambra Dr
- 4637 Rothbury Common
- 3100 Mackenzie Place
- 3402 Pinewood Terrace Unit 211
- 35856 Adobe Dr
- 3416 Deerwood Terrace Unit 113
- 4095 Tawny Terrace Unit 8
- 4091 Tawny Terrace Unit 7
- 4110 Vintage Terrace Unit 14
- 4106 Vintage Terrace
- 4107 Tawny Terrace Unit 11
- 4103 Tawny Terrace
- 4100 Tawny Terrace Unit 4
- 4096 Tawny Terrace Unit 5
- 4092 Tawny Terrace Unit 6
- 4111 Tawny Terrace
- 36369 Fremont Blvd Unit 6
- 4108 Tawny Terrace
- 36367 Fremont Blvd
- 36365 Fremont Blvd
- 4112 Tawny Terrace
- 36371 Fremont Blvd Unit 5
- 4097 Vintage Terrace
- 36363 Fremont Blvd Unit 9
- 4101 Vintage Terrace
- 4105 Vintage Terrace