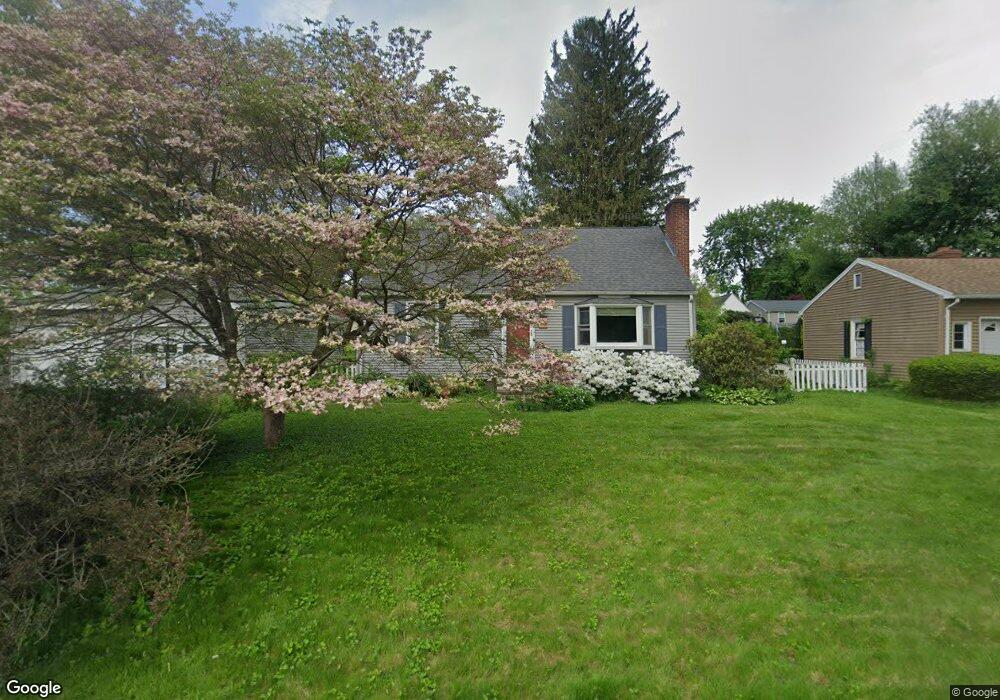
41 Almon Ave West Springfield, MA 01089
Estimated Value: $284,000 - $318,000
2
Beds
1
Bath
884
Sq Ft
$338/Sq Ft
Est. Value
About This Home
This home is located at 41 Almon Ave, West Springfield, MA 01089 and is currently estimated at $298,539, approximately $337 per square foot. 41 Almon Ave is a home located in Hampden County with nearby schools including West Springfield High School and St Thomas The Apostle School.
Ownership History
Date
Name
Owned For
Owner Type
Purchase Details
Closed on
Jul 2, 2008
Sold by
Marquis Charles R and Marquis Charles T
Bought by
Marquis Charles R and Marquis Lynn D
Current Estimated Value
Home Financials for this Owner
Home Financials are based on the most recent Mortgage that was taken out on this home.
Original Mortgage
$77,000
Interest Rate
6.01%
Mortgage Type
Purchase Money Mortgage
Purchase Details
Closed on
Feb 12, 1993
Sold by
Zombik Robert and Zombik Mafalda E
Bought by
Marquis Charles R and Marquis Lynn
Home Financials for this Owner
Home Financials are based on the most recent Mortgage that was taken out on this home.
Original Mortgage
$81,200
Interest Rate
8.13%
Mortgage Type
Purchase Money Mortgage
Create a Home Valuation Report for This Property
The Home Valuation Report is an in-depth analysis detailing your home's value as well as a comparison with similar homes in the area
Home Values in the Area
Average Home Value in this Area
Purchase History
| Date | Buyer | Sale Price | Title Company |
|---|---|---|---|
| Marquis Charles R | -- | -- | |
| Marquis Charles R | $101,500 | -- |
Source: Public Records
Mortgage History
| Date | Status | Borrower | Loan Amount |
|---|---|---|---|
| Open | Marquis Charles R | $85,000 | |
| Closed | Marquis Charles R | $77,000 | |
| Previous Owner | Marquis Charles R | $81,200 | |
| Previous Owner | Marquis Charles R | $15,000 |
Source: Public Records
Tax History
| Year | Tax Paid | Tax Assessment Tax Assessment Total Assessment is a certain percentage of the fair market value that is determined by local assessors to be the total taxable value of land and additions on the property. | Land | Improvement |
|---|---|---|---|---|
| 2025 | $3,597 | $241,900 | $108,000 | $133,900 |
| 2024 | $3,597 | $242,900 | $108,000 | $134,900 |
| 2023 | $3,420 | $220,100 | $108,000 | $112,100 |
| 2022 | $3,147 | $199,700 | $98,000 | $101,700 |
| 2021 | $3,022 | $178,800 | $90,800 | $88,000 |
| 2020 | $3,038 | $178,800 | $90,800 | $88,000 |
| 2019 | $3,032 | $178,800 | $90,800 | $88,000 |
| 2018 | $3,049 | $178,800 | $90,800 | $88,000 |
| 2017 | $3,049 | $178,800 | $90,800 | $88,000 |
| 2016 | $3,004 | $176,800 | $87,300 | $89,500 |
| 2015 | $2,949 | $173,600 | $85,600 | $88,000 |
| 2014 | $715 | $173,600 | $85,600 | $88,000 |
Source: Public Records
Map
Nearby Homes
- 144 Almon Ave
- 1996 Westfield St
- 43 Houston Rd
- 117 Sibley Ave
- 27 Marlene Dr
- 65 Churchill Rd
- 62 Talcott Ave
- 24 E View Dr
- 65 Verdugo St
- 88 Verdugo St
- 40 Nolan Ln
- 240 Morton St
- 61 Clarence St
- lot A North St
- 999 N Street Extension
- 81 Chestnut St
- 189 Springfield Rd Unit 23
- 0 E Mountain Rd
- 468 Springfield St
- 19 Church St
Your Personal Tour Guide
Ask me questions while you tour the home.