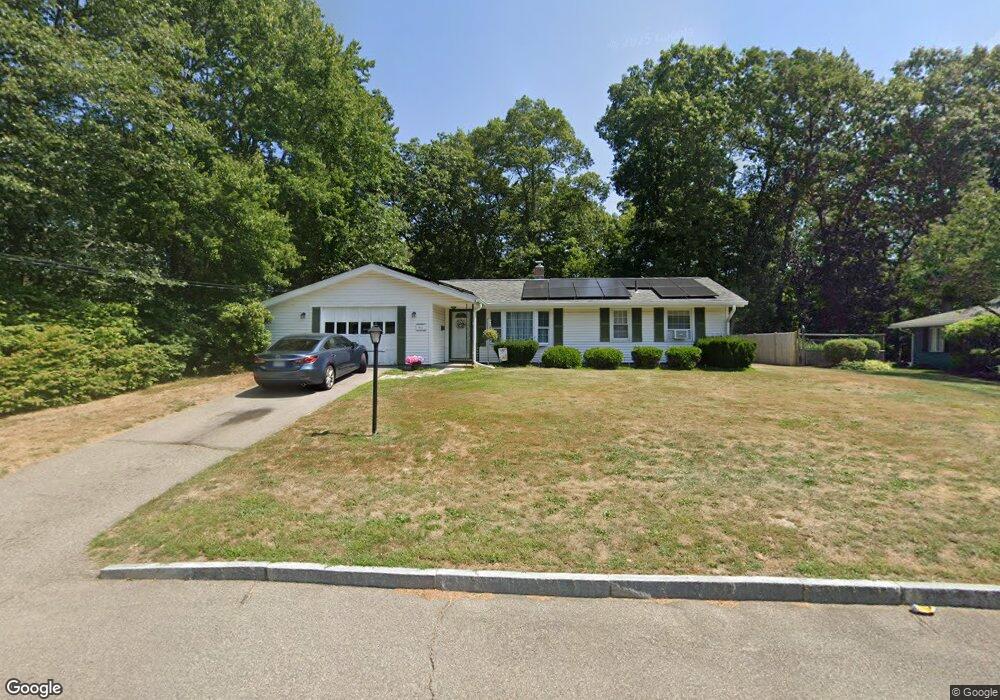
41 Alphonse Rd Brockton, MA 02302
Montello NeighborhoodEstimated Value: $453,833 - $482,000
3
Beds
1
Bath
1,088
Sq Ft
$429/Sq Ft
Est. Value
About This Home
This home is located at 41 Alphonse Rd, Brockton, MA 02302 and is currently estimated at $466,458, approximately $428 per square foot. 41 Alphonse Rd is a home located in Plymouth County with nearby schools including Brookfield Elementary School, Mary E. Baker Elementary School, and Downey Elementary School.
Ownership History
Date
Name
Owned For
Owner Type
Purchase Details
Closed on
Feb 14, 2012
Sold by
Gilleece Jane M and Gileece Kevin J
Bought by
Gilleece Jane M
Current Estimated Value
Purchase Details
Closed on
Aug 28, 1998
Sold by
White Joan A
Bought by
Gilleece Kevin J and Gilleece Jane M
Purchase Details
Closed on
Apr 28, 1998
Sold by
Adams James M
Bought by
White Joan A
Purchase Details
Closed on
Nov 23, 1994
Sold by
Beaudin Melinda A and Hoyle Edward H
Bought by
Adams James M
Create a Home Valuation Report for This Property
The Home Valuation Report is an in-depth analysis detailing your home's value as well as a comparison with similar homes in the area
Home Values in the Area
Average Home Value in this Area
Purchase History
| Date | Buyer | Sale Price | Title Company |
|---|---|---|---|
| Gilleece Jane M | -- | -- | |
| Gilleece Kevin J | $109,900 | -- | |
| White Joan A | $105,000 | -- | |
| Adams James M | $77,000 | -- |
Source: Public Records
Mortgage History
| Date | Status | Borrower | Loan Amount |
|---|---|---|---|
| Previous Owner | Adams James M | $217,000 | |
| Previous Owner | Adams James M | $29,600 | |
| Previous Owner | Adams James M | $133,000 |
Source: Public Records
Tax History
| Year | Tax Paid | Tax Assessment Tax Assessment Total Assessment is a certain percentage of the fair market value that is determined by local assessors to be the total taxable value of land and additions on the property. | Land | Improvement |
|---|---|---|---|---|
| 2025 | $4,902 | $404,800 | $164,500 | $240,300 |
| 2024 | $4,776 | $397,300 | $164,500 | $232,800 |
| 2023 | $4,557 | $351,100 | $130,800 | $220,300 |
| 2022 | $4,448 | $318,400 | $119,500 | $198,900 |
| 2021 | $4,085 | $281,700 | $107,300 | $174,400 |
| 2020 | $4,072 | $268,800 | $102,800 | $166,000 |
| 2019 | $4,037 | $259,800 | $95,500 | $164,300 |
| 2018 | $3,524 | $219,400 | $95,500 | $123,900 |
| 2017 | $3,252 | $202,000 | $95,500 | $106,500 |
| 2016 | $3,295 | $189,800 | $92,200 | $97,600 |
| 2015 | $3,256 | $179,400 | $92,200 | $87,200 |
| 2014 | $3,263 | $180,000 | $92,200 | $87,800 |
Source: Public Records
Map
Nearby Homes
Your Personal Tour Guide
Ask me questions while you tour the home.