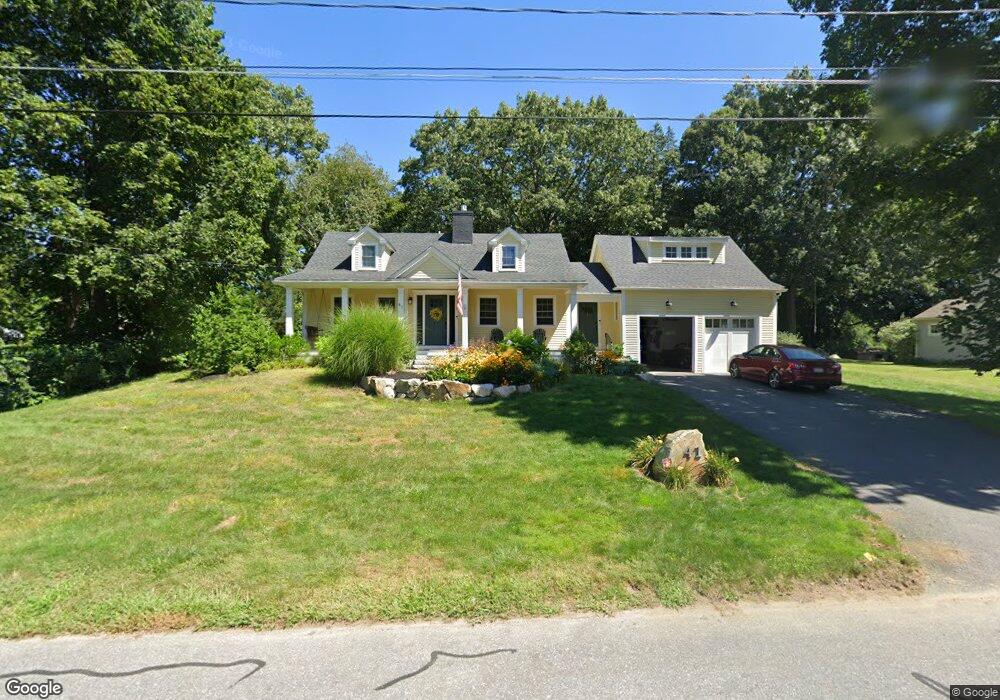
41 Ash St Concord, MA 01742
Estimated Value: $1,087,000 - $1,721,757
4
Beds
2
Baths
1,685
Sq Ft
$868/Sq Ft
Est. Value
About This Home
This home is located at 41 Ash St, Concord, MA 01742 and is currently estimated at $1,462,939, approximately $868 per square foot. 41 Ash St is a home located in Middlesex County with nearby schools including Alcott Elementary School, Concord Middle School, and Concord Carlisle High School.
Ownership History
Date
Name
Owned For
Owner Type
Purchase Details
Closed on
Jun 27, 2016
Sold by
James P Desrosiers Ret
Bought by
Farber Brian and Dodson Katherine S
Current Estimated Value
Home Financials for this Owner
Home Financials are based on the most recent Mortgage that was taken out on this home.
Original Mortgage
$504,000
Outstanding Balance
$394,651
Interest Rate
3%
Mortgage Type
New Conventional
Estimated Equity
$1,068,288
Purchase Details
Closed on
Mar 8, 2016
Sold by
Desrosiers Claudia and Desrosiers James P
Bought by
James P Desrosiers Ret and Desrosiers James P
Purchase Details
Closed on
Dec 1, 2015
Sold by
Madeline Inman Irt and Desrosiers James P
Bought by
Desrosiers Claudia and Desrosiers James P
Purchase Details
Closed on
Jun 13, 2013
Sold by
Inman Madeline
Bought by
Madeline Inman Irt and Desrosiers James P
Purchase Details
Closed on
Apr 21, 2011
Sold by
Inman Ft and Om Am James J
Bought by
Inman Madeline
Create a Home Valuation Report for This Property
The Home Valuation Report is an in-depth analysis detailing your home's value as well as a comparison with similar homes in the area
Home Values in the Area
Average Home Value in this Area
Purchase History
| Date | Buyer | Sale Price | Title Company |
|---|---|---|---|
| Farber Brian | $630,000 | -- | |
| James P Desrosiers Ret | -- | -- | |
| Desrosiers Claudia | -- | -- | |
| Madeline Inman Irt | -- | -- | |
| Inman Madeline | -- | -- |
Source: Public Records
Mortgage History
| Date | Status | Borrower | Loan Amount |
|---|---|---|---|
| Open | Farber Brian | $504,000 |
Source: Public Records
Tax History
| Year | Tax Paid | Tax Assessment Tax Assessment Total Assessment is a certain percentage of the fair market value that is determined by local assessors to be the total taxable value of land and additions on the property. | Land | Improvement |
|---|---|---|---|---|
| 2025 | $191 | $1,441,600 | $567,000 | $874,600 |
| 2024 | $18,432 | $1,403,800 | $529,200 | $874,600 |
| 2023 | $15,762 | $1,216,200 | $504,100 | $712,100 |
| 2022 | $14,397 | $975,400 | $366,600 | $608,800 |
| 2021 | $14,333 | $973,700 | $366,600 | $607,100 |
| 2020 | $13,449 | $945,100 | $320,700 | $624,400 |
| 2019 | $13,388 | $943,500 | $329,200 | $614,300 |
| 2018 | $10,234 | $716,200 | $330,400 | $385,800 |
| 2017 | $7,581 | $538,800 | $314,700 | $224,100 |
| 2016 | $6,778 | $486,900 | $282,400 | $204,500 |
| 2015 | $6,935 | $485,300 | $298,900 | $186,400 |
Source: Public Records
Map
Nearby Homes
- 96 Independence Rd
- 612 Lexington Rd
- 50 Wayside Rd
- 7 Blue Heron Way
- 97 Hawthorne Ln
- 6 Parker Rd
- 212 Hawthorne Ln
- 105 Lexington Rd
- 646 Cambridge Turnpike
- 44 Sarah Way
- 181 Stow St
- 6 Smith Hill Rd
- 143 Everett St
- 46 Sudbury Rd
- 61B Walden St
- 381 Thoreau St
- 165 Everett St
- 150 Hubbard St Unit B
- 25 Glenridge Dr
- 16 Old Cambridge Turnpike
Your Personal Tour Guide
Ask me questions while you tour the home.