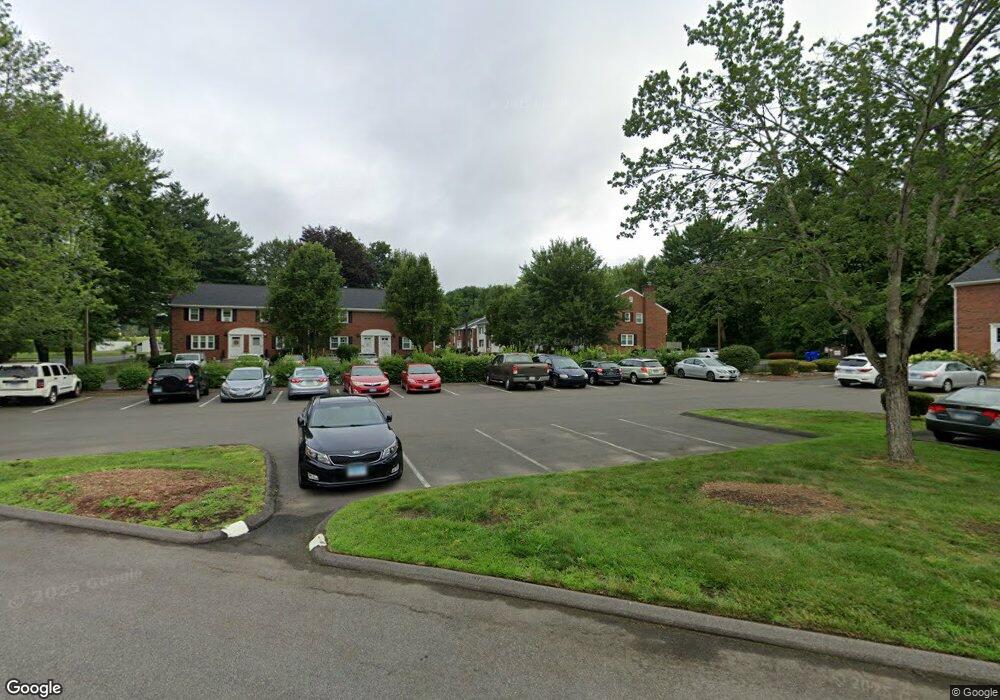
41 Brandywine Ln Unit 41 Suffield, CT 06078
Estimated Value: $252,418 - $349,000
2
Beds
2
Baths
1,340
Sq Ft
$207/Sq Ft
Est. Value
About This Home
This home is located at 41 Brandywine Ln Unit 41, Suffield, CT 06078 and is currently estimated at $277,355, approximately $206 per square foot. 41 Brandywine Ln Unit 41 is a home located in Hartford County with nearby schools including A. Ward Spaulding School, Mcalister Intermediate School, and Suffield Middle School.
Ownership History
Date
Name
Owned For
Owner Type
Purchase Details
Closed on
Jun 3, 2019
Sold by
Forti Frank P
Bought by
Napui Joseph R
Current Estimated Value
Home Financials for this Owner
Home Financials are based on the most recent Mortgage that was taken out on this home.
Original Mortgage
$145,350
Outstanding Balance
$128,055
Interest Rate
4.2%
Mortgage Type
Purchase Money Mortgage
Estimated Equity
$149,300
Purchase Details
Closed on
Sep 13, 2004
Sold by
Sheridan William and Sheridan Barbara
Bought by
Forti Frank and Forti Mary
Home Financials for this Owner
Home Financials are based on the most recent Mortgage that was taken out on this home.
Original Mortgage
$116,000
Interest Rate
5.12%
Purchase Details
Closed on
Nov 21, 1989
Sold by
Ayubi Parviz
Bought by
Sheridan William
Home Financials for this Owner
Home Financials are based on the most recent Mortgage that was taken out on this home.
Original Mortgage
$77,000
Interest Rate
9.97%
Create a Home Valuation Report for This Property
The Home Valuation Report is an in-depth analysis detailing your home's value as well as a comparison with similar homes in the area
Home Values in the Area
Average Home Value in this Area
Purchase History
| Date | Buyer | Sale Price | Title Company |
|---|---|---|---|
| Napui Joseph R | $153,000 | -- | |
| Forti Frank | $145,000 | -- | |
| Sheridan William | $123,000 | -- |
Source: Public Records
Mortgage History
| Date | Status | Borrower | Loan Amount |
|---|---|---|---|
| Open | Napui Joseph R | $145,350 | |
| Previous Owner | Sheridan William | $108,000 | |
| Previous Owner | Sheridan William | $116,000 | |
| Previous Owner | Sheridan William | $77,000 |
Source: Public Records
Tax History
| Year | Tax Paid | Tax Assessment Tax Assessment Total Assessment is a certain percentage of the fair market value that is determined by local assessors to be the total taxable value of land and additions on the property. | Land | Improvement |
|---|---|---|---|---|
| 2025 | $3,163 | $135,100 | $0 | $135,100 |
| 2024 | $3,057 | $135,100 | $0 | $135,100 |
| 2023 | $2,920 | $102,060 | $0 | $102,060 |
| 2022 | $2,920 | $102,060 | $0 | $102,060 |
| 2021 | $2,923 | $102,060 | $0 | $102,060 |
| 2020 | $2,895 | $101,080 | $0 | $101,080 |
| 2019 | $2,899 | $100,940 | $0 | $100,940 |
| 2018 | $3,038 | $103,600 | $0 | $103,600 |
| 2017 | $2,993 | $103,600 | $0 | $103,600 |
| 2016 | $2,922 | $103,600 | $0 | $103,600 |
| 2015 | $2,878 | $103,600 | $0 | $103,600 |
| 2014 | $2,810 | $103,600 | $0 | $103,600 |
Source: Public Records
Map
Nearby Homes
- 424 Bridge St
- 0 Stone St S Unit 24039713
- 0 Suffield St Unit 24093452
- 0 Suffield St Unit 24057050
- 1 E Elaine Dr
- 18 Daniel Cir Unit 18
- 15 Downing Way
- 713 Thrall Ave
- 485 Mountain Rd
- 779 Bridge St
- 813 Overhill Dr
- 278 Thompsonville Rd
- 120 2nd St
- 72 Spencer St
- 98 1st St
- 9 Green Briar Dr Unit 9
- 4 Pebblestone Cir
- 315 East St S
- 24 Pebblestone Cir Unit 24
- 155 Mountain Laurel Way
- 46 Brandywine Ln
- 45 Brandywine Ln
- 44 Brandywine Ln
- 43 Brandywine Ln
- 42 Brandywine Ln
- 41 Brandywine Ln
- 40 Brandywine Ln
- 39 Brandywine Ln
- 38 Brandywine Ln
- 37 Brandywine Ln
- 36 Brandywine Ln
- 39 Brandywine Ln Unit 39
- 44 Brandywine Ln Unit 44
- 46 Brandywine Ln Unit 46
- 42 Brandywine Ln Unit 42
- 43 Brandywine Ln Unit 43
- 30 Brandywine Ln
- 30 Brandywine Ln Unit 30
- 28 Brandywine Ln
- 28 Brandywine Ln Unit 28
Your Personal Tour Guide
Ask me questions while you tour the home.