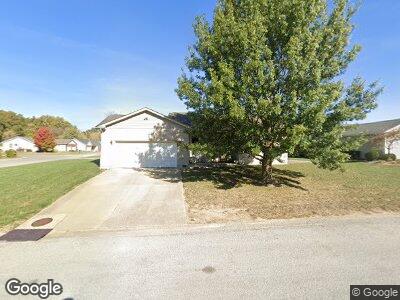
41 Briarwood Ln Aviston, IL 62216
East Brook Estates NeighborhoodEstimated Value: $172,000 - $217,000
3
Beds
1
Bath
1,072
Sq Ft
$180/Sq Ft
Est. Value
About This Home
This home is located at 41 Briarwood Ln, Aviston, IL 62216 and is currently estimated at $193,243, approximately $180 per square foot. 41 Briarwood Ln is a home located in Clinton County with nearby schools including Aviston Elementary School, Central Community High School, and All Saints Academy.
Ownership History
Date
Name
Owned For
Owner Type
Purchase Details
Closed on
Feb 2, 2012
Sold by
Kohlbrecher Steven M
Bought by
Kohlbrecher Properties
Current Estimated Value
Home Financials for this Owner
Home Financials are based on the most recent Mortgage that was taken out on this home.
Original Mortgage
$32,000
Outstanding Balance
$5,638
Interest Rate
3.25%
Mortgage Type
Credit Line Revolving
Estimated Equity
$183,726
Purchase Details
Closed on
Jan 9, 2008
Sold by
Friederich Nicholas and Friederich Jennifer C
Bought by
Kohlbrecher Steven M
Home Financials for this Owner
Home Financials are based on the most recent Mortgage that was taken out on this home.
Original Mortgage
$108,120
Interest Rate
5.96%
Mortgage Type
New Conventional
Create a Home Valuation Report for This Property
The Home Valuation Report is an in-depth analysis detailing your home's value as well as a comparison with similar homes in the area
Home Values in the Area
Average Home Value in this Area
Purchase History
| Date | Buyer | Sale Price | Title Company |
|---|---|---|---|
| Kohlbrecher Properties | -- | None Available | |
| Kohlbrecher Properties | -- | None Available | |
| Kohlbrecher Properties | -- | None Available | |
| Kohlbrecher Properties | -- | None Available | |
| Kohlbrecher Steven M | $103,000 | None Available |
Source: Public Records
Mortgage History
| Date | Status | Borrower | Loan Amount |
|---|---|---|---|
| Open | Voss Chad L | $32,000 | |
| Previous Owner | Kohlbrecher Properties | $110,000 | |
| Previous Owner | Kohlbrecher Properties | $110,000 | |
| Previous Owner | Kohlbrecher Steven M | $108,120 | |
| Previous Owner | Freidrich Nicholas | $92,000 |
Source: Public Records
Tax History Compared to Growth
Tax History
| Year | Tax Paid | Tax Assessment Tax Assessment Total Assessment is a certain percentage of the fair market value that is determined by local assessors to be the total taxable value of land and additions on the property. | Land | Improvement |
|---|---|---|---|---|
| 2023 | $3,415 | $52,100 | $5,080 | $47,020 |
| 2022 | $3,415 | $41,460 | $4,600 | $36,860 |
| 2021 | $2,550 | $39,480 | $4,380 | $35,100 |
| 2020 | $2,546 | $37,960 | $4,210 | $33,750 |
| 2019 | $2,540 | $37,960 | $4,210 | $33,750 |
| 2018 | $2,692 | $38,494 | $4,316 | $34,178 |
| 2017 | $2,631 | $36,660 | $4,110 | $32,550 |
| 2016 | $2,648 | $36,660 | $4,110 | $32,550 |
| 2015 | $2,035 | $36,660 | $4,110 | $32,550 |
| 2013 | $2,035 | $37,530 | $4,110 | $33,420 |
Source: Public Records
Map
Nearby Homes