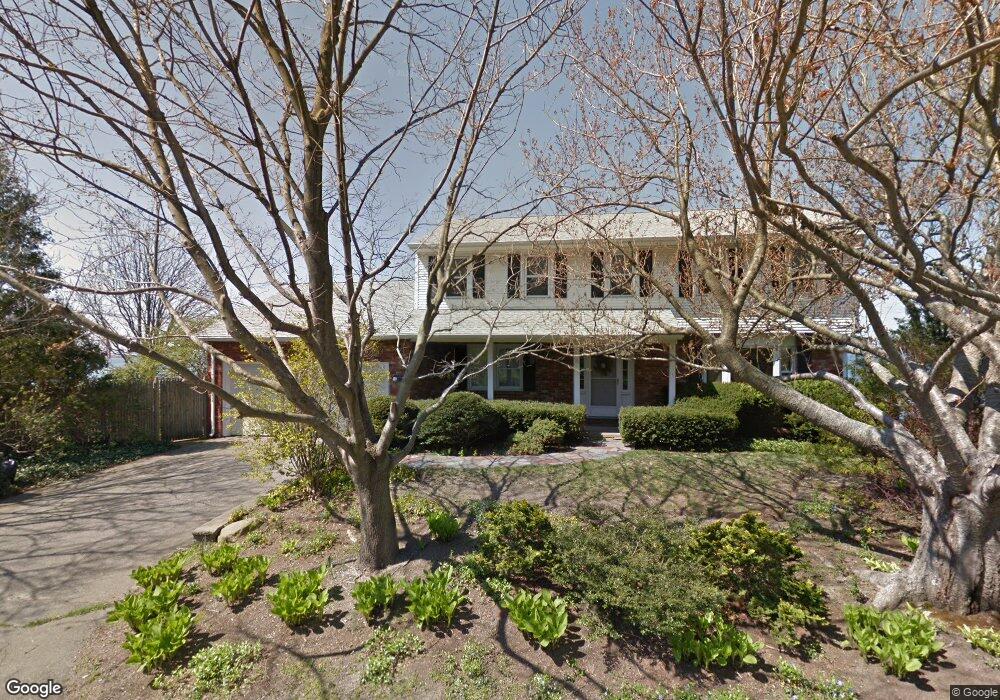
41 Brookwood Rd Bristol, RI 02809
Bristol Highlands NeighborhoodEstimated Value: $994,000 - $1,760,000
4
Beds
4
Baths
3,284
Sq Ft
$429/Sq Ft
Est. Value
About This Home
This home is located at 41 Brookwood Rd, Bristol, RI 02809 and is currently estimated at $1,408,341, approximately $428 per square foot. 41 Brookwood Rd is a home located in Bristol County with nearby schools including Mt. Hope High School, Our Lady of Mt. Carmel School, and East Bay Career Academy.
Ownership History
Date
Name
Owned For
Owner Type
Purchase Details
Closed on
Feb 13, 2015
Sold by
Calvert Steven L and Calvert Patricia L
Bought by
Steven L Calvert T and Patricia L Calvert T
Current Estimated Value
Purchase Details
Closed on
May 28, 1999
Sold by
Krushnowski John D and Krushnowski Ann Marie
Bought by
Calvert Steven L and Calvert Patricia
Create a Home Valuation Report for This Property
The Home Valuation Report is an in-depth analysis detailing your home's value as well as a comparison with similar homes in the area
Home Values in the Area
Average Home Value in this Area
Purchase History
| Date | Buyer | Sale Price | Title Company |
|---|---|---|---|
| Steven L Calvert T | -- | -- | |
| Calvert Steven L | $420,000 | -- |
Source: Public Records
Mortgage History
| Date | Status | Borrower | Loan Amount |
|---|---|---|---|
| Previous Owner | Calvert Steven L | $200,000 | |
| Previous Owner | Calvert Steven L | $150,000 | |
| Previous Owner | Calvert Steven L | $50,000 |
Source: Public Records
Tax History Compared to Growth
Tax History
| Year | Tax Paid | Tax Assessment Tax Assessment Total Assessment is a certain percentage of the fair market value that is determined by local assessors to be the total taxable value of land and additions on the property. | Land | Improvement |
|---|---|---|---|---|
| 2025 | $12,432 | $899,600 | $549,800 | $349,800 |
| 2024 | $12,432 | $899,600 | $549,800 | $349,800 |
| 2023 | $11,918 | $892,100 | $549,800 | $342,300 |
| 2022 | $11,597 | $892,100 | $549,800 | $342,300 |
| 2021 | $12,048 | $837,800 | $546,400 | $291,400 |
| 2020 | $11,788 | $837,800 | $546,400 | $291,400 |
| 2019 | $11,495 | $837,800 | $546,400 | $291,400 |
| 2018 | $12,487 | $811,900 | $550,100 | $261,800 |
| 2017 | $11,077 | $742,400 | $496,800 | $245,600 |
| 2016 | $10,482 | $709,700 | $496,800 | $212,900 |
| 2015 | $9,957 | $709,700 | $496,800 | $212,900 |
| 2014 | $8,868 | $679,000 | $432,400 | $246,600 |
Source: Public Records
Map
Nearby Homes
- 17 Shore Rd
- 61 Mulberry Rd
- 0 Surf Dr
- 40 Aaron Ave
- 3 Chestnut St
- 1220 Hope St
- 1 Knowlton Ct
- 7 Knowlton Ct
- 3 Knowlton Ct
- 5 Knowlton Ct
- 94 Windward Ln
- 413 High St
- 694 Hope St
- 107 Franklin St
- 669 Metacom Ave Unit 17
- 21 Bradford St Unit 2
- 2 Bagy Wrinkle Cove
- 44 Bradford St Unit 48
- 44 Bradford St Unit 49
- 44 Bradford St Unit 52