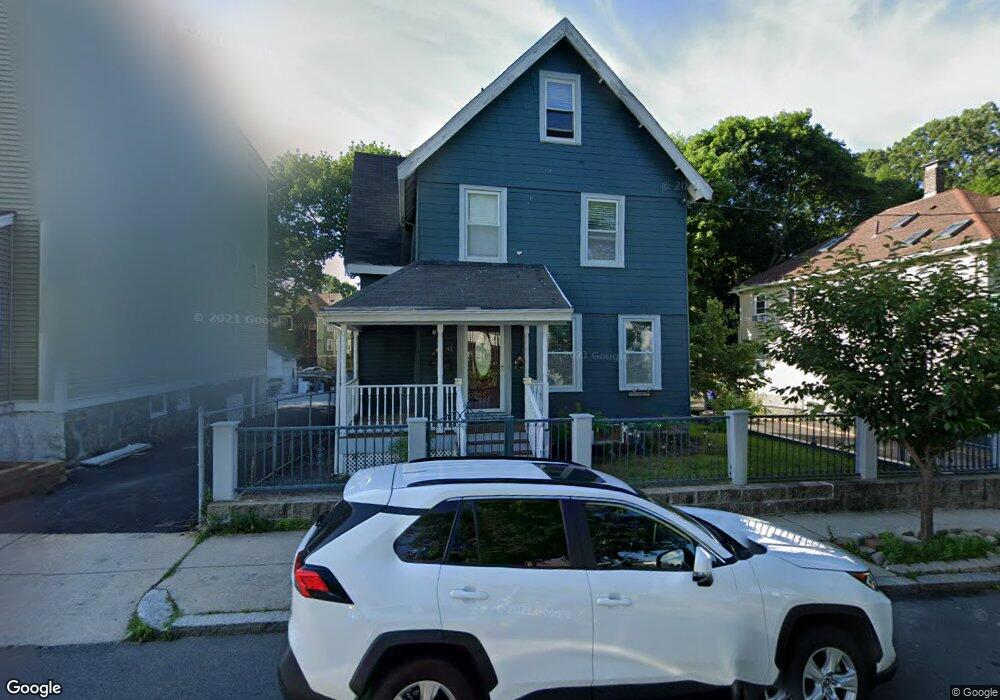
41 Burt St Unit 1 Dorchester Center, MA 02124
Ashmont NeighborhoodEstimated Value: $819,000 - $911,000
5
Beds
2
Baths
1,575
Sq Ft
$546/Sq Ft
Est. Value
About This Home
This home is located at 41 Burt St Unit 1, Dorchester Center, MA 02124 and is currently estimated at $859,831, approximately $545 per square foot. 41 Burt St Unit 1 is a home located in Suffolk County with nearby schools including Codman Academy Charter Public School and Epiphany School.
Ownership History
Date
Name
Owned For
Owner Type
Purchase Details
Closed on
Jun 30, 2021
Sold by
Nguyen Liem
Bought by
Oppel Brett and Oleary Nicholas
Current Estimated Value
Home Financials for this Owner
Home Financials are based on the most recent Mortgage that was taken out on this home.
Original Mortgage
$704,000
Outstanding Balance
$638,771
Interest Rate
2.9%
Mortgage Type
Purchase Money Mortgage
Estimated Equity
$221,060
Purchase Details
Closed on
Dec 31, 2015
Sold by
Deutsche Bank Natl T C
Bought by
Nguyen Liem
Purchase Details
Closed on
Oct 13, 2006
Sold by
Cueva Maria P and Cueva Raul
Bought by
Chitolie Aaron and Trent Rosalind
Home Financials for this Owner
Home Financials are based on the most recent Mortgage that was taken out on this home.
Original Mortgage
$280,000
Interest Rate
6.47%
Mortgage Type
Purchase Money Mortgage
Purchase Details
Closed on
Mar 20, 1991
Sold by
Caballero Raul G and Howell Emma G
Bought by
Caballero Raul G and Cueva Argentina R
Create a Home Valuation Report for This Property
The Home Valuation Report is an in-depth analysis detailing your home's value as well as a comparison with similar homes in the area
Home Values in the Area
Average Home Value in this Area
Purchase History
| Date | Buyer | Sale Price | Title Company |
|---|---|---|---|
| Oppel Brett | $749,000 | None Available | |
| Nguyen Liem | $243,414 | -- | |
| Chitolie Aaron | $350,000 | -- | |
| Caballero Raul G | $80,000 | -- |
Source: Public Records
Mortgage History
| Date | Status | Borrower | Loan Amount |
|---|---|---|---|
| Open | Oppel Brett | $704,000 | |
| Previous Owner | Chitolie Aaron | $280,000 | |
| Previous Owner | Caballero Raul G | $67,000 |
Source: Public Records
Tax History Compared to Growth
Tax History
| Year | Tax Paid | Tax Assessment Tax Assessment Total Assessment is a certain percentage of the fair market value that is determined by local assessors to be the total taxable value of land and additions on the property. | Land | Improvement |
|---|---|---|---|---|
| 2025 | $7,782 | $672,000 | $254,900 | $417,100 |
| 2024 | $6,869 | $630,200 | $190,500 | $439,700 |
| 2023 | $6,324 | $588,800 | $178,000 | $410,800 |
| 2022 | $5,122 | $470,800 | $164,800 | $306,000 |
| 2021 | $4,907 | $459,900 | $164,800 | $295,100 |
| 2020 | $4,423 | $418,800 | $150,100 | $268,700 |
| 2019 | $4,172 | $395,800 | $139,800 | $256,000 |
| 2018 | $3,950 | $376,900 | $139,800 | $237,100 |
| 2017 | $3,991 | $376,900 | $139,800 | $237,100 |
| 2016 | $3,912 | $355,600 | $139,800 | $215,800 |
| 2015 | $3,767 | $311,100 | $118,600 | $192,500 |
| 2014 | $3,495 | $277,800 | $118,600 | $159,200 |
Source: Public Records
Map
Nearby Homes
- 58 Bailey St
- 74 Burt St Unit 303
- 74 Burt St Unit 201
- 72 Bailey St
- 47 Roslin St Unit 1
- 7 Bailey St Unit 2
- 77 Bailey St
- 27 Armandine St Unit 1
- 84 Bailey St
- 1910 Dorchester Ave Unit 617
- 1910 Dorchester Ave Unit 601
- 2 Ogden St Unit 1
- 44 Mora St
- 29 Torrey St
- 52 Withington St Unit 7
- 39 Torrey St Unit 1
- 157-159 Fuller St
- 72 Mora St
- 438 Talbot Ave
- 39 Chipman St