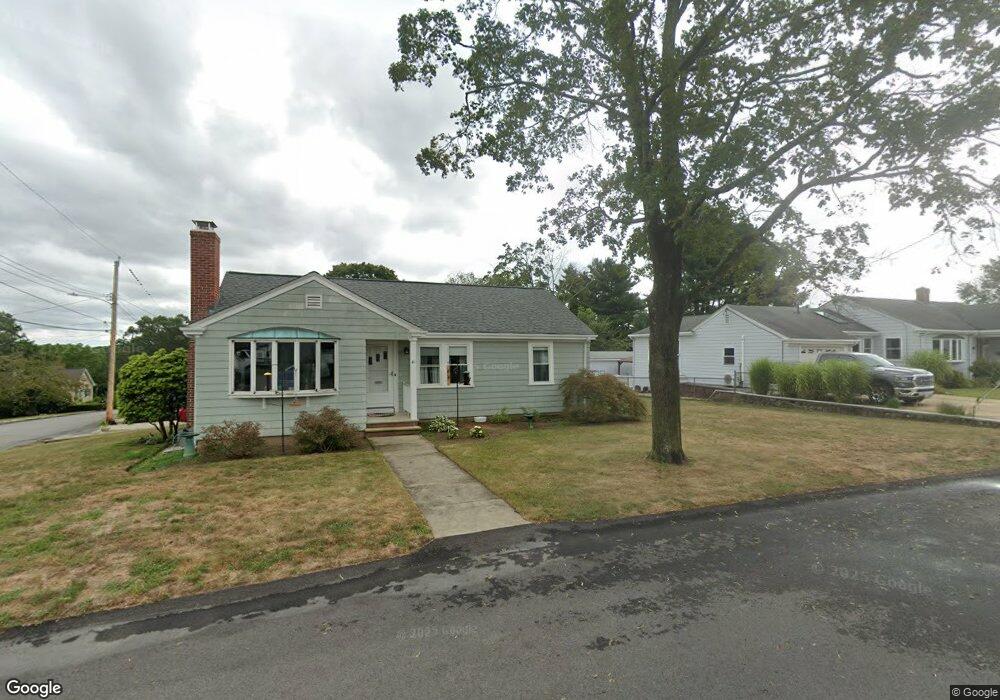
41 Carlson Cir West Warwick, RI 02893
Centreville NeighborhoodEstimated Value: $372,000 - $418,000
3
Beds
1
Bath
1,118
Sq Ft
$355/Sq Ft
Est. Value
About This Home
This home is located at 41 Carlson Cir, West Warwick, RI 02893 and is currently estimated at $396,551, approximately $354 per square foot. 41 Carlson Cir is a home located in Kent County with nearby schools including West Warwick High School.
Ownership History
Date
Name
Owned For
Owner Type
Purchase Details
Closed on
May 3, 2018
Sold by
Damore Frank J and Damore William D
Bought by
Wisne Karen and Damore William M
Current Estimated Value
Purchase Details
Closed on
Dec 28, 2015
Sold by
Damore Evelyn B
Bought by
Damore Frank J and Damore William M
Purchase Details
Closed on
Dec 9, 2015
Sold by
Damore Evelyn B
Bought by
Damore Frank J and Damore William M
Create a Home Valuation Report for This Property
The Home Valuation Report is an in-depth analysis detailing your home's value as well as a comparison with similar homes in the area
Home Values in the Area
Average Home Value in this Area
Purchase History
| Date | Buyer | Sale Price | Title Company |
|---|---|---|---|
| Wisne Karen | $180,000 | -- | |
| Damore Frank J | -- | -- | |
| Damore Frank J | -- | -- |
Source: Public Records
Mortgage History
| Date | Status | Borrower | Loan Amount |
|---|---|---|---|
| Previous Owner | Damore Frank J | $100,000 | |
| Previous Owner | Damore Frank J | $25,000 |
Source: Public Records
Tax History Compared to Growth
Tax History
| Year | Tax Paid | Tax Assessment Tax Assessment Total Assessment is a certain percentage of the fair market value that is determined by local assessors to be the total taxable value of land and additions on the property. | Land | Improvement |
|---|---|---|---|---|
| 2025 | $4,923 | $344,500 | $111,900 | $232,600 |
| 2024 | $4,659 | $249,300 | $74,900 | $174,400 |
| 2023 | $4,567 | $249,300 | $74,900 | $174,400 |
| 2022 | $4,497 | $249,300 | $74,900 | $174,400 |
| 2021 | $4,329 | $188,200 | $62,400 | $125,800 |
| 2020 | $4,329 | $188,200 | $62,400 | $125,800 |
| 2019 | $5,518 | $188,200 | $62,400 | $125,800 |
| 2018 | $3,833 | $154,900 | $64,900 | $90,000 |
| 2017 | $4,075 | $154,900 | $64,900 | $90,000 |
| 2016 | $4,003 | $154,900 | $64,900 | $90,000 |
| 2015 | $3,954 | $152,300 | $64,900 | $87,400 |
| 2014 | $924 | $152,300 | $64,900 | $87,400 |
Source: Public Records
Map
Nearby Homes
- 34 Buckley Ave
- 3 June Ct
- 170 Cowesett Ave
- 177 Cowesett Ave
- 94 Cowesett Ave Unit 8
- 25 School St
- 6 Teresa Ann Crossing
- 2 Teresa Ann Crossing
- 8 Teresa Ann Crossing
- 4 Teresa Ann Crossing
- 16 Ontario St
- 64 Lockwood St
- 25 Fawn Ln
- 33 Judy Terrace
- 40 E Greenwich Ave
- 38 New London Ave
- 45 Judy Terrace
- 46 Trellis Dr
- 30 Birchwood Ln
- 125 Setian Ln