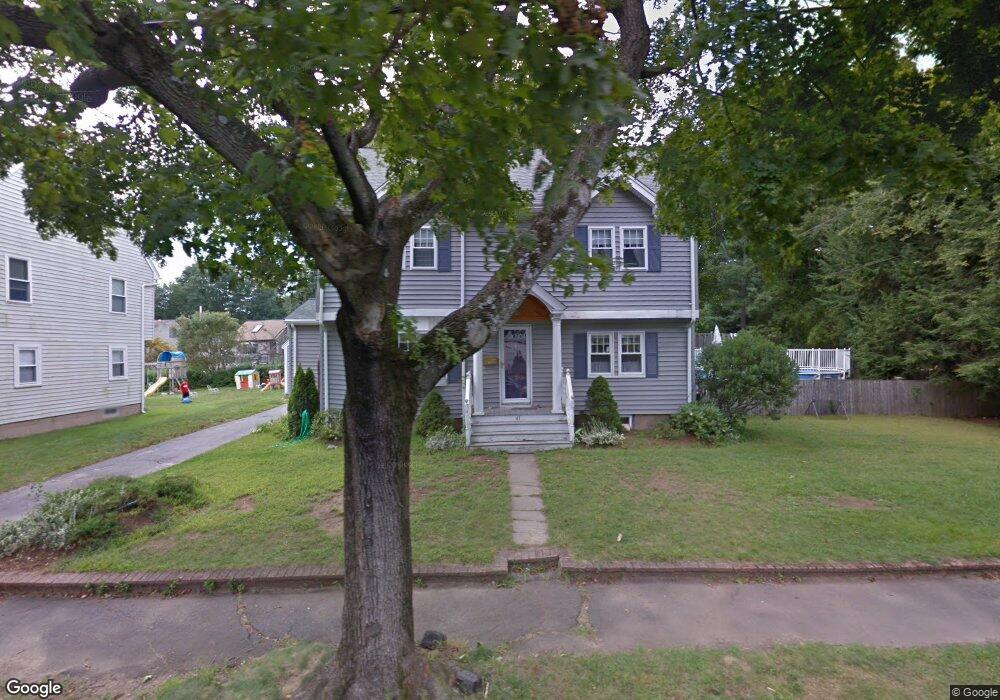
41 Chapman Rd Wakefield, MA 01880
Montrose NeighborhoodEstimated Value: $796,000 - $889,000
3
Beds
2
Baths
1,600
Sq Ft
$537/Sq Ft
Est. Value
About This Home
This home is located at 41 Chapman Rd, Wakefield, MA 01880 and is currently estimated at $859,583, approximately $537 per square foot. 41 Chapman Rd is a home located in Middlesex County with nearby schools including Wakefield Memorial High School, St Joseph School, and Our Lady Of Assumption School.
Ownership History
Date
Name
Owned For
Owner Type
Purchase Details
Closed on
Jul 26, 2002
Sold by
Arrington Mark P
Bought by
Amyouny Joseph R and Amyouny Sharon A
Current Estimated Value
Purchase Details
Closed on
Apr 6, 2001
Sold by
Johnson Eric G and Johnson Tracy L
Bought by
Arrington Mark P
Purchase Details
Closed on
Jan 18, 1995
Sold by
Bailey Wayne E and Bailey Nancy M
Bought by
Johnson Eric G and Johnson Tracy L
Create a Home Valuation Report for This Property
The Home Valuation Report is an in-depth analysis detailing your home's value as well as a comparison with similar homes in the area
Home Values in the Area
Average Home Value in this Area
Purchase History
| Date | Buyer | Sale Price | Title Company |
|---|---|---|---|
| Amyouny Joseph R | $383,500 | -- | |
| Arrington Mark P | $339,100 | -- | |
| Johnson Eric G | $158,500 | -- | |
| Johnson Eric G | $158,500 | -- |
Source: Public Records
Mortgage History
| Date | Status | Borrower | Loan Amount |
|---|---|---|---|
| Open | Johnson Eric G | $312,000 | |
| Closed | Johnson Eric G | $321,000 |
Source: Public Records
Tax History
| Year | Tax Paid | Tax Assessment Tax Assessment Total Assessment is a certain percentage of the fair market value that is determined by local assessors to be the total taxable value of land and additions on the property. | Land | Improvement |
|---|---|---|---|---|
| 2025 | $8,829 | $777,900 | $393,000 | $384,900 |
| 2024 | $8,497 | $755,300 | $381,400 | $373,900 |
| 2023 | $8,215 | $700,300 | $353,200 | $347,100 |
| 2022 | $7,855 | $637,600 | $321,100 | $316,500 |
| 2021 | $7,531 | $591,600 | $298,300 | $293,300 |
| 2020 | $7,241 | $567,000 | $286,000 | $281,000 |
| 2019 | $7,024 | $547,500 | $276,100 | $271,400 |
| 2018 | $6,649 | $513,400 | $258,900 | $254,500 |
| 2017 | $6,369 | $488,800 | $246,500 | $242,300 |
| 2016 | $6,061 | $449,300 | $227,900 | $221,400 |
| 2015 | $5,670 | $420,600 | $213,000 | $207,600 |
| 2014 | $5,212 | $407,800 | $206,400 | $201,400 |
Source: Public Records
Map
Nearby Homes
- 5 Jessica Ln
- 68 Preston St Unit 6D
- 350 Water St
- 57 Wave Ave
- 9 Cyrus St
- 67 Woodcrest Dr
- 16 Pleasant St
- 10 Wakefield Ave Unit B
- 21 Herbert St Unit A
- 35 Richardson St Unit 2
- 43-45 Crescent St
- 29 Cordis St
- 1 Traverse St Unit E
- 0 Everett St
- 16 Beebe Ln
- 34 Stark Ave
- 61 Nahant St
- 11 Elizabeth Way
- 9 Tuttle Ln
- 82 Water St
Your Personal Tour Guide
Ask me questions while you tour the home.