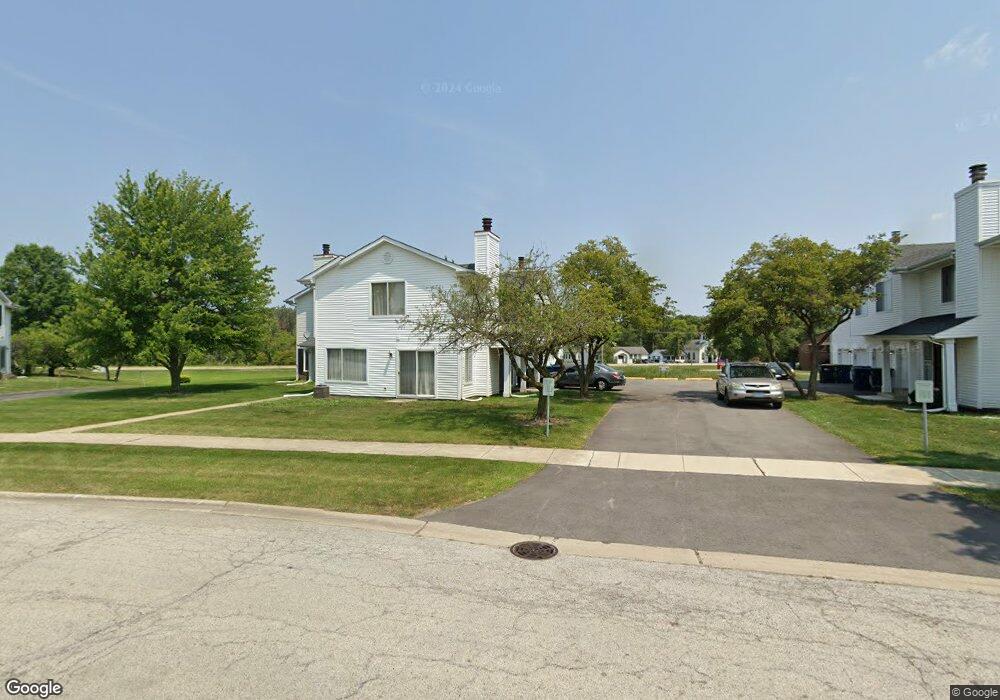
41 Churn Rd Unit 16 Matteson, IL 60443
West Matteson NeighborhoodEstimated Value: $114,000 - $144,000
2
Beds
2
Baths
50,062
Sq Ft
$3/Sq Ft
Est. Value
About This Home
This home is located at 41 Churn Rd Unit 16, Matteson, IL 60443 and is currently estimated at $129,803, approximately $2 per square foot. 41 Churn Rd Unit 16 is a home located in Cook County with nearby schools including Colin Powell Middle School and Dr. Wolfe's Montessori School.
Ownership History
Date
Name
Owned For
Owner Type
Purchase Details
Closed on
Nov 21, 2011
Sold by
Goldman Sachs Mortgage Company
Bought by
Williams Idayat F
Current Estimated Value
Purchase Details
Closed on
Jun 7, 2010
Sold by
Mccraven
Bought by
Goldman Sachs Mortgage Company
Purchase Details
Closed on
Apr 25, 2005
Sold by
Fannie Mae
Bought by
Mccraven Tom
Home Financials for this Owner
Home Financials are based on the most recent Mortgage that was taken out on this home.
Original Mortgage
$90,320
Interest Rate
6.25%
Mortgage Type
Purchase Money Mortgage
Purchase Details
Closed on
Oct 19, 2004
Sold by
Cooksey William
Bought by
Federal National Mortgage Association
Purchase Details
Closed on
Sep 18, 1996
Sold by
Farmer Jo Ann
Bought by
Cooksey William
Home Financials for this Owner
Home Financials are based on the most recent Mortgage that was taken out on this home.
Original Mortgage
$82,650
Interest Rate
8%
Create a Home Valuation Report for This Property
The Home Valuation Report is an in-depth analysis detailing your home's value as well as a comparison with similar homes in the area
Home Values in the Area
Average Home Value in this Area
Purchase History
| Date | Buyer | Sale Price | Title Company |
|---|---|---|---|
| Williams Idayat F | $30,000 | None Available | |
| Goldman Sachs Mortgage Company | -- | None Available | |
| Mccraven Tom | -- | First American Title | |
| Federal National Mortgage Association | -- | -- | |
| Cooksey William | $87,000 | -- |
Source: Public Records
Mortgage History
| Date | Status | Borrower | Loan Amount |
|---|---|---|---|
| Previous Owner | Mccraven Tom | $90,320 | |
| Previous Owner | Cooksey William | $82,650 | |
| Closed | Mccraven Tom | $22,580 |
Source: Public Records
Tax History Compared to Growth
Tax History
| Year | Tax Paid | Tax Assessment Tax Assessment Total Assessment is a certain percentage of the fair market value that is determined by local assessors to be the total taxable value of land and additions on the property. | Land | Improvement |
|---|---|---|---|---|
| 2024 | $2,951 | $10,437 | $1,885 | $8,552 |
| 2023 | $2,575 | $10,437 | $1,885 | $8,552 |
| 2022 | $2,575 | $8,230 | $1,542 | $6,688 |
| 2021 | $2,647 | $8,229 | $1,542 | $6,687 |
| 2020 | $2,677 | $8,229 | $1,542 | $6,687 |
| 2019 | $4,466 | $11,603 | $1,370 | $10,233 |
| 2018 | $4,398 | $11,603 | $1,370 | $10,233 |
| 2017 | $4,477 | $11,926 | $1,370 | $10,556 |
| 2016 | $2,628 | $7,575 | $1,285 | $6,290 |
| 2015 | $2,516 | $7,575 | $1,285 | $6,290 |
| 2014 | $2,475 | $7,575 | $1,285 | $6,290 |
| 2013 | $3,169 | $9,518 | $1,285 | $8,233 |
Source: Public Records
Map
Nearby Homes
- 10 Wedgewood Rd
- 50 Willow Rd
- 42 Pheasant Rd
- 5943 Woodgate Dr
- 25 Pheasant Rd
- 5911 Timberlane Rd
- 13 Oakview Rd
- 123 Oriole Rd
- 5838 Woodgate Dr
- 217 Oriole Rd
- 433 Wheatfield Rd
- 6226 Beechwood Rd
- 111 Deerpath Rd
- 6230 Streamwood Ln
- 116 Cloverleaf Rd
- 5728 Woodgate Dr
- 37 Corinth Dr
- 6306 Beaver Dam Rd
- 43 Corinth Dr
- 5808 Allemong Dr
- 43 Churn Rd Unit 46
- 45 Churn Rd Unit 36
- 47 Churn Rd Unit 26
- 47 Churn Rd Unit 5-6
- 35 Churn Rd Unit 35
- 39 Churn Rd Unit 15
- 37 Churn Rd Unit 45
- 49 Churn Rd Unit 27
- 33 Churn Rd Unit 25
- 33 Churn Rd Unit 33
- 33 Churn Rd Unit 1
- 51 Churn Rd Unit 37
- 53 Churn Rd Unit 47
- 63 Churn Rd Unit 28
- 61 Churn Rd Unit 38
- 55 Churn Rd Unit 17
- 59 Churn Rd Unit 48
- 57 Churn Rd Unit 18
- 31 Churn Rd Unit 24
- 40 Churn Rd Unit 212