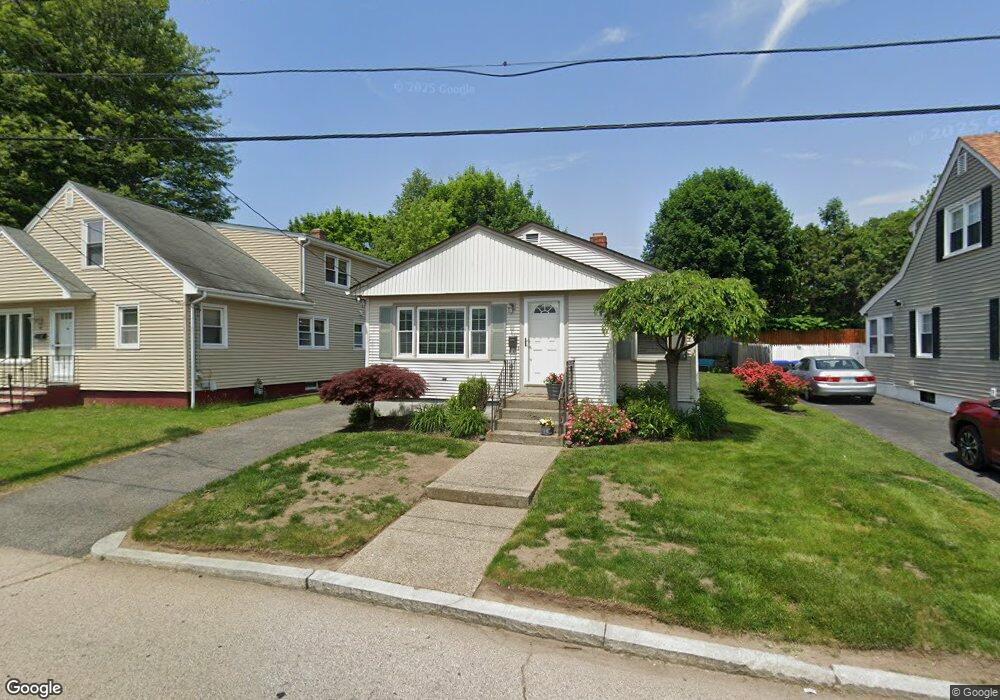
41 Compton St Providence, RI 02908
Mount Pleasant NeighborhoodEstimated Value: $371,000 - $412,000
2
Beds
1
Bath
1,068
Sq Ft
$366/Sq Ft
Est. Value
About This Home
This home is located at 41 Compton St, Providence, RI 02908 and is currently estimated at $390,476, approximately $365 per square foot. 41 Compton St is a home located in Providence County with nearby schools including St. Augustine School, St. Pius V Catholic School, and Mount Pleasant Academy.
Ownership History
Date
Name
Owned For
Owner Type
Purchase Details
Closed on
Nov 16, 2009
Sold by
Es Santopodre Amelia L
Bought by
Cherella Roberta
Current Estimated Value
Home Financials for this Owner
Home Financials are based on the most recent Mortgage that was taken out on this home.
Original Mortgage
$147,283
Outstanding Balance
$95,681
Interest Rate
4.98%
Mortgage Type
Purchase Money Mortgage
Estimated Equity
$294,795
Create a Home Valuation Report for This Property
The Home Valuation Report is an in-depth analysis detailing your home's value as well as a comparison with similar homes in the area
Home Values in the Area
Average Home Value in this Area
Purchase History
| Date | Buyer | Sale Price | Title Company |
|---|---|---|---|
| Cherella Roberta | $150,000 | -- |
Source: Public Records
Mortgage History
| Date | Status | Borrower | Loan Amount |
|---|---|---|---|
| Open | Cherella Roberta | $147,283 | |
| Closed | Cherella Roberta | $5,250 | |
| Closed | Cherella Roberta | $4,000 |
Source: Public Records
Tax History
| Year | Tax Paid | Tax Assessment Tax Assessment Total Assessment is a certain percentage of the fair market value that is determined by local assessors to be the total taxable value of land and additions on the property. | Land | Improvement |
|---|---|---|---|---|
| 2025 | $3,042 | $362,200 | $161,000 | $201,200 |
| 2024 | $5,105 | $278,200 | $104,600 | $173,600 |
| 2023 | $5,105 | $278,200 | $104,600 | $173,600 |
| 2022 | $4,952 | $278,200 | $104,600 | $173,600 |
| 2021 | $4,870 | $198,300 | $81,500 | $116,800 |
| 2020 | $4,870 | $198,300 | $81,500 | $116,800 |
| 2019 | $4,870 | $198,300 | $81,500 | $116,800 |
| 2018 | $4,478 | $140,100 | $65,500 | $74,600 |
| 2017 | $4,478 | $140,100 | $65,500 | $74,600 |
| 2016 | $4,455 | $139,400 | $64,800 | $74,600 |
| 2015 | $4,263 | $128,800 | $64,800 | $64,000 |
| 2014 | $4,347 | $128,800 | $64,800 | $64,000 |
| 2013 | $4,347 | $128,800 | $64,800 | $64,000 |
Source: Public Records
Map
Nearby Homes
- 1189 Smith St
- 84 Enfield Ave
- 68 Enfield Ave
- 31 Elmcrest Ave
- 46 Longwood Ave
- 112 Longwood Ave
- 116 Longwood Ave
- 797 Academy Ave
- 36 Walton St
- 354 Jastram St
- 299 Jastram St
- 165 Whitford Ave
- 119 Farm St
- 73 High Service Ave
- 493 Academy Ave
- 507 Sharon St
- 41 Wellesley Ave
- 616 River Ave
- 21 Webb St
- 39 Hillview Ave
Your Personal Tour Guide
Ask me questions while you tour the home.