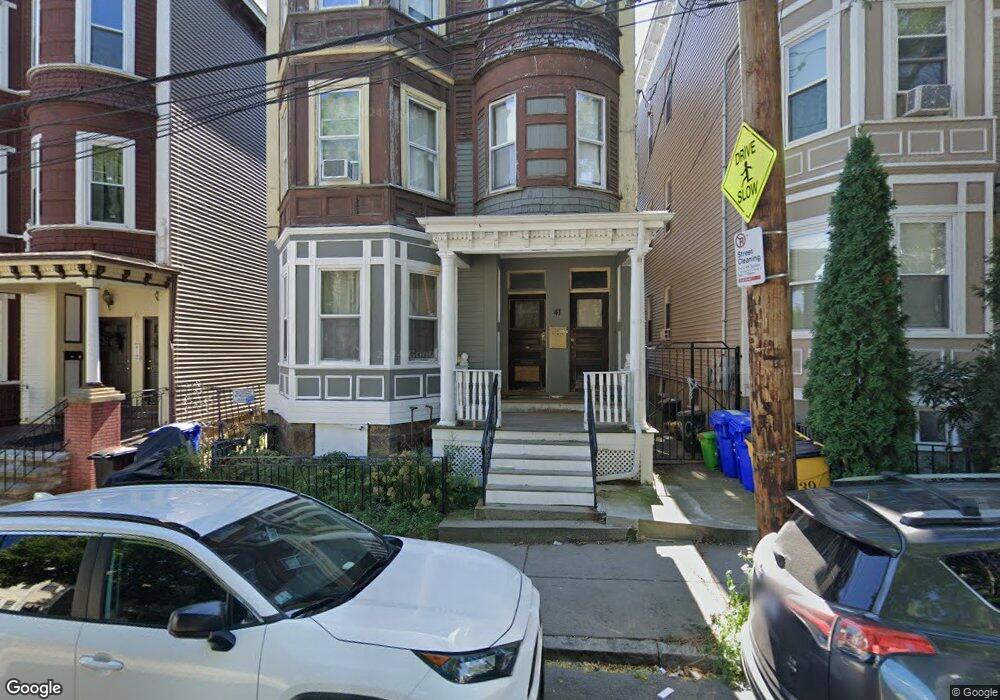
41 Copeland St Roxbury, MA 02119
Sav-Mor NeighborhoodEstimated Value: $1,079,000 - $1,164,000
8
Beds
3
Baths
4,501
Sq Ft
$249/Sq Ft
Est. Value
About This Home
This home is located at 41 Copeland St, Roxbury, MA 02119 and is currently estimated at $1,119,333, approximately $248 per square foot. 41 Copeland St is a home located in Suffolk County with nearby schools including Dudley Street Neighborhood Charter School and City on a Hill Charter Public School.
Ownership History
Date
Name
Owned For
Owner Type
Purchase Details
Closed on
Nov 14, 1994
Sold by
Ahad Abdul
Bought by
Capers Elaine P
Current Estimated Value
Purchase Details
Closed on
Oct 1, 1993
Sold by
Shawmut Mtg Co
Bought by
Ahad Abdul
Purchase Details
Closed on
Apr 21, 1993
Sold by
Adams Hellana L and Shawmut Mtg Co
Bought by
Shawmut Mtg Co
Purchase Details
Closed on
Jun 21, 1989
Sold by
Murad Elie
Bought by
Adams Hellana L
Purchase Details
Closed on
Dec 15, 1988
Sold by
Thornton Will B
Bought by
Murad Elie
Create a Home Valuation Report for This Property
The Home Valuation Report is an in-depth analysis detailing your home's value as well as a comparison with similar homes in the area
Home Values in the Area
Average Home Value in this Area
Purchase History
| Date | Buyer | Sale Price | Title Company |
|---|---|---|---|
| Capers Elaine P | $102,000 | -- | |
| Ahad Abdul | $60,000 | -- | |
| Shawmut Mtg Co | $135,900 | -- | |
| Adams Hellana L | $225,000 | -- | |
| Murad Elie | $130,000 | -- |
Source: Public Records
Mortgage History
| Date | Status | Borrower | Loan Amount |
|---|---|---|---|
| Open | Murad Elie | $3,000 | |
| Open | Murad Elie | $215,000 |
Source: Public Records
Tax History Compared to Growth
Tax History
| Year | Tax Paid | Tax Assessment Tax Assessment Total Assessment is a certain percentage of the fair market value that is determined by local assessors to be the total taxable value of land and additions on the property. | Land | Improvement |
|---|---|---|---|---|
| 2025 | $9,655 | $833,800 | $187,200 | $646,600 |
| 2024 | $8,403 | $770,900 | $189,900 | $581,000 |
| 2023 | $7,886 | $734,300 | $180,900 | $553,400 |
| 2022 | $7,605 | $699,000 | $172,200 | $526,800 |
| 2021 | $7,103 | $665,700 | $164,000 | $501,700 |
| 2020 | $5,586 | $529,000 | $170,100 | $358,900 |
| 2019 | $4,979 | $472,400 | $122,300 | $350,100 |
| 2018 | $4,584 | $437,400 | $122,300 | $315,100 |
| 2017 | $4,632 | $437,400 | $122,300 | $315,100 |
| 2016 | $4,183 | $380,300 | $122,300 | $258,000 |
| 2015 | $3,679 | $303,800 | $86,400 | $217,400 |
| 2014 | $3,570 | $283,800 | $86,400 | $197,400 |
Source: Public Records
Map
Nearby Homes
- 7 Langford Park Unit 3
- 30 Copeland St Unit 1
- 59 Perrin St
- 59 Perrin St Unit 1
- 33 Copeland Park Unit C
- 22 Alaska St
- 10 Rockland St Unit 4
- 31 Alaska St
- 119 Blue Hill Ave
- 133 Blue Hill Ave
- 45 Woodville St
- 80 Blue Hill Ave Unit 5
- Lot 84 Blue Hill Ave
- 22 Rockville Park
- 20 Rockville Park
- 62 Clifford St Unit A
- 79 W Cottage St
- 101 Mount Pleasant Ave
- 94 Walnut Ave
- 12 Gayland St
- 39 Copeland St Unit 3
- 39 Copeland St Unit 2
- 39 Copeland St Unit 1
- 39 Copeland St
- 43 Copeland St
- 37 Copeland St Unit 3
- 37 Copeland St Unit 2
- 37 Copeland St Unit 1
- 45 Copeland St
- 3 Langford Park
- 1 Langford Park
- 3 Langford Park Unit 3
- 3 Langford Park Unit 3,3
- 33 Copeland St Unit B
- 33 Copeland St Unit F
- 5 Langford Park
- 5 Langford Park Unit 3
- 49 Copeland St Unit 2
- 49 Copeland St
- 49 Copeland St Unit 1