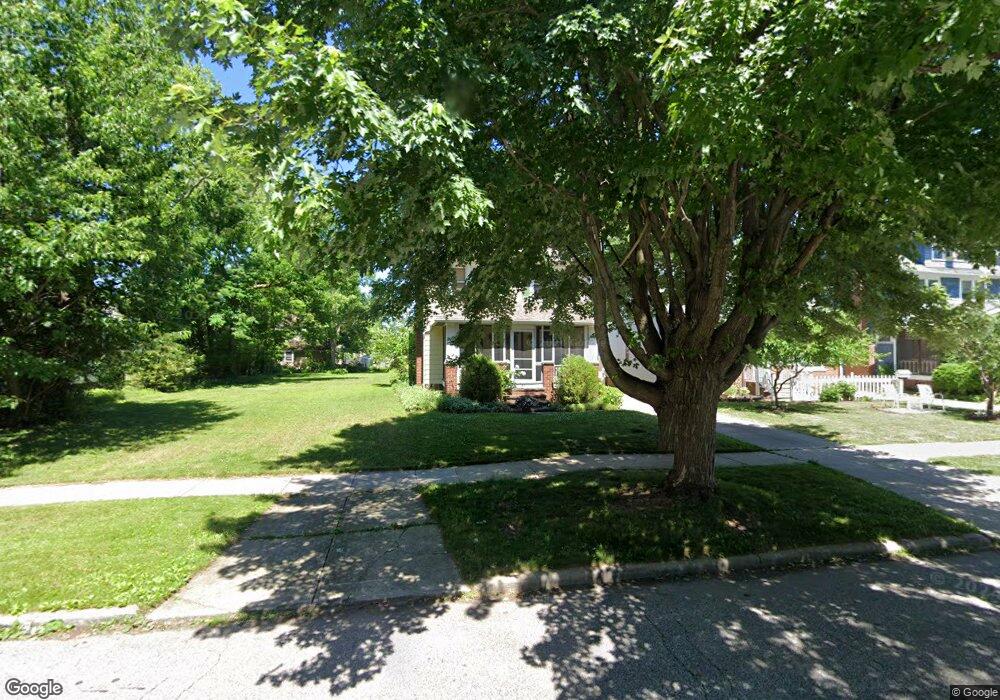
41 E 219th St Euclid, OH 44123
Estimated Value: $155,032 - $226,000
3
Beds
1
Bath
1,379
Sq Ft
$132/Sq Ft
Est. Value
About This Home
This home is located at 41 E 219th St, Euclid, OH 44123 and is currently estimated at $182,508, approximately $132 per square foot. 41 E 219th St is a home located in Cuyahoga County with nearby schools including Bluestone Elementary School, Euclid High School, and Pinnacle Academy.
Ownership History
Date
Name
Owned For
Owner Type
Purchase Details
Closed on
Sep 27, 2006
Sold by
Hall Amanda M and Hall William E
Bought by
Fuerst Kathleen E
Current Estimated Value
Home Financials for this Owner
Home Financials are based on the most recent Mortgage that was taken out on this home.
Original Mortgage
$100,000
Outstanding Balance
$60,067
Interest Rate
6.58%
Mortgage Type
Purchase Money Mortgage
Estimated Equity
$122,441
Purchase Details
Closed on
Apr 12, 2001
Sold by
Baden Jesse R and Jo Mary
Bought by
Garrett Amanda M
Home Financials for this Owner
Home Financials are based on the most recent Mortgage that was taken out on this home.
Original Mortgage
$85,600
Interest Rate
7.05%
Purchase Details
Closed on
May 23, 1984
Sold by
Brayman Theron R
Bought by
Baden Jesse R
Purchase Details
Closed on
Apr 5, 1983
Sold by
Bixby Kenneth E and Bixby Anne M
Bought by
Brayman Theron R
Purchase Details
Closed on
Jan 1, 1975
Bought by
Bixby Kenneth E and Bixby Anne M
Create a Home Valuation Report for This Property
The Home Valuation Report is an in-depth analysis detailing your home's value as well as a comparison with similar homes in the area
Home Values in the Area
Average Home Value in this Area
Purchase History
| Date | Buyer | Sale Price | Title Company |
|---|---|---|---|
| Fuerst Kathleen E | $125,000 | Landamerica | |
| Garrett Amanda M | $107,000 | Chicago Title Insurance Comp | |
| Baden Jesse R | $63,000 | -- | |
| Brayman Theron R | $52,000 | -- | |
| Bixby Kenneth E | -- | -- |
Source: Public Records
Mortgage History
| Date | Status | Borrower | Loan Amount |
|---|---|---|---|
| Open | Fuerst Kathleen E | $100,000 | |
| Previous Owner | Garrett Amanda M | $85,600 | |
| Closed | Garrett Amanda M | $16,050 |
Source: Public Records
Tax History Compared to Growth
Tax History
| Year | Tax Paid | Tax Assessment Tax Assessment Total Assessment is a certain percentage of the fair market value that is determined by local assessors to be the total taxable value of land and additions on the property. | Land | Improvement |
|---|---|---|---|---|
| 2024 | $2,670 | $48,125 | $10,955 | $37,170 |
| 2023 | $2,051 | $32,240 | $9,030 | $23,210 |
| 2022 | $2,039 | $32,240 | $9,030 | $23,210 |
| 2021 | $2,266 | $32,240 | $9,030 | $23,210 |
| 2020 | $2,235 | $29,860 | $8,370 | $21,490 |
| 2019 | $1,981 | $84,400 | $23,900 | $60,500 |
| 2018 | $2,220 | $29,540 | $8,370 | $21,180 |
| 2017 | $2,638 | $31,990 | $7,140 | $24,850 |
| 2016 | $2,644 | $31,990 | $7,140 | $24,850 |
| 2015 | $2,408 | $31,990 | $7,140 | $24,850 |
| 2014 | $2,408 | $31,990 | $7,140 | $24,850 |
Source: Public Records
Map
Nearby Homes
- 104 E 216th St
- 226 E 216th St
- 174 E 212th St
- 254 E 214th St
- 290 E 216th St
- 231 E 210th St
- 144 E 208th St
- 441 Kenwood Dr Unit M
- 22000 Kennison Ave
- 461 Kenwood Dr Unit T3
- 421 Kenwood Dr Unit G
- 450 Kenwood Dr Unit E12
- 430 Kenwood Dr Unit C11
- 470 Kenwood Dr Unit D
- 23198 Gay St
- 21561 Maydale Ave
- 121 E 205th St
- 23307 Williams Ave
- 490 Kenwood Dr Unit B
- 324 E 235th St