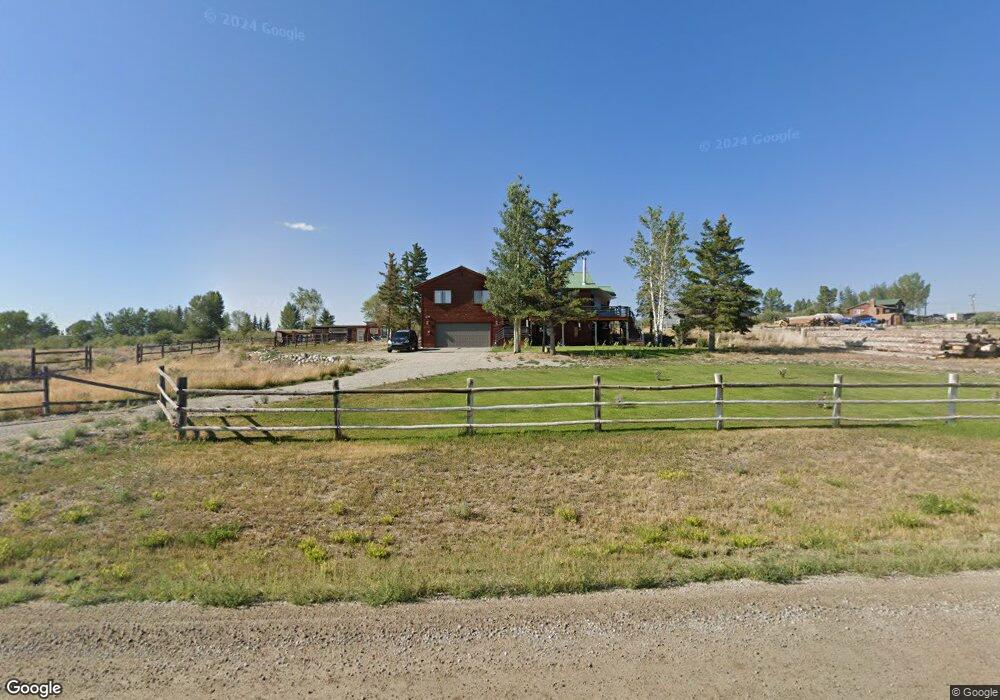
41 Favazzo Subdivision Rd Pinedale, WY 82941
Estimated Value: $697,890 - $714,000
3
Beds
3
Baths
2,898
Sq Ft
$244/Sq Ft
Est. Value
About This Home
This home is located at 41 Favazzo Subdivision Rd, Pinedale, WY 82941 and is currently estimated at $705,945, approximately $243 per square foot. 41 Favazzo Subdivision Rd is a home located in Sublette County with nearby schools including Pinedale High School.
Ownership History
Date
Name
Owned For
Owner Type
Purchase Details
Closed on
Jul 23, 2025
Sold by
Joffrion Brandi and Kokopelli Asset Holdings Llc
Bought by
La Providencia Holdings Llc
Current Estimated Value
Purchase Details
Closed on
Mar 23, 2018
Sold by
Fannie Mae and Federal National Mortgage Association -
Bought by
Makelky Eric and Makelky Emily
Purchase Details
Closed on
Mar 20, 2018
Sold by
Fannie Mae
Bought by
Makelky Eric and Makelky Emily
Purchase Details
Closed on
Feb 16, 2018
Sold by
Ditech Financial Llc
Bought by
Federal National Mortgage Assn
Purchase Details
Closed on
Feb 1, 2018
Sold by
Ditech Financial Llc
Bought by
Federal National Mortgage Association
Purchase Details
Closed on
Jan 26, 2018
Sold by
Kerr James A and Kerr Susan M
Bought by
Ditech Financial Llc and Green Tree Servicing Llc
Create a Home Valuation Report for This Property
The Home Valuation Report is an in-depth analysis detailing your home's value as well as a comparison with similar homes in the area
Home Values in the Area
Average Home Value in this Area
Purchase History
| Date | Buyer | Sale Price | Title Company |
|---|---|---|---|
| La Providencia Holdings Llc | -- | None Listed On Document | |
| La Providencia Holdings Llc | -- | None Listed On Document | |
| Makelky Eric | -- | None Listed On Document | |
| Makelky Eric | -- | None Available | |
| Federal National Mortgage Assn | -- | None Listed On Document | |
| Federal National Mortgage Association | -- | None Available | |
| Ditech Financial Llc | $304,900 | None Available | |
| Bank Of America Na | $304,900 | None Listed On Document |
Source: Public Records
Tax History Compared to Growth
Tax History
| Year | Tax Paid | Tax Assessment Tax Assessment Total Assessment is a certain percentage of the fair market value that is determined by local assessors to be the total taxable value of land and additions on the property. | Land | Improvement |
|---|---|---|---|---|
| 2025 | $2,524 | $37,512 | $4,703 | $32,809 |
| 2024 | $3,125 | $48,313 | $6,270 | $42,043 |
| 2023 | $2,926 | $46,713 | $6,270 | $40,443 |
| 2022 | $2,363 | $37,429 | $6,270 | $31,159 |
| 2021 | $1,895 | $31,626 | $5,700 | $25,926 |
| 2020 | $1,895 | $30,555 | $5,700 | $24,855 |
| 2019 | $1,816 | $29,586 | $5,415 | $24,171 |
| 2018 | $1,884 | $30,772 | $5,415 | $25,357 |
| 2017 | $1,889 | $31,008 | $5,415 | $25,593 |
| 2016 | $1,877 | $30,576 | $5,415 | $25,161 |
| 2015 | -- | $30,597 | $5,415 | $25,182 |
| 2014 | -- | $26,668 | $7,125 | $19,543 |
| 2013 | -- | $26,476 | $7,220 | $19,256 |
Source: Public Records
Map
Nearby Homes
- 11 Broken Hill Dr
- 4 Glacier Hills
- 14 Carmichael Loop
- 152 Fremont Lake Rd
- LOT#22 Carmichael Loop
- 19 Orcutt Dr
- 7 Faler Ln
- TBD Broken Hills
- 62 Skyline St
- 639 S Pine St
- 21 E Pine St
- 117 W Pine St
- 315 S Fremont Ave
- 174 W Magnolia St
- 17 C B Ln
- 136 N Lake Ave
- 516 Moose St
- 97 Riverside Rd
- 0 Lot 92 Split Diamond Unit 25-1094
- TBD LOT 80 Klein Loop
- 41 Favazzo Subdivision Rd Unit 23-199
- 41 Favazzo Rd Unit 23-199
- 41 Favazzo Rd
- 11 Black Bear Dr
- 48 Favazzo Sub 23-199
- 63 Black Bear Dr
- 51 Favazzo Rd
- 79 Favazzo Lot 18
- 81 Favazzo Rd
- 79 Favazzo Subdivision Rd
- 79 Favazzo Rd
- 8 Black Bear Dr
- 36 Favazzo Rd
- 75 Favazzo Sub 23-199
- 85 Favazzo Rd
- 32 Favazzo Rd
- 82 Favazzo Sub
- 82 Favazzo Rd
- 101 Favazzo Rd
- 88 Favazzo Rd