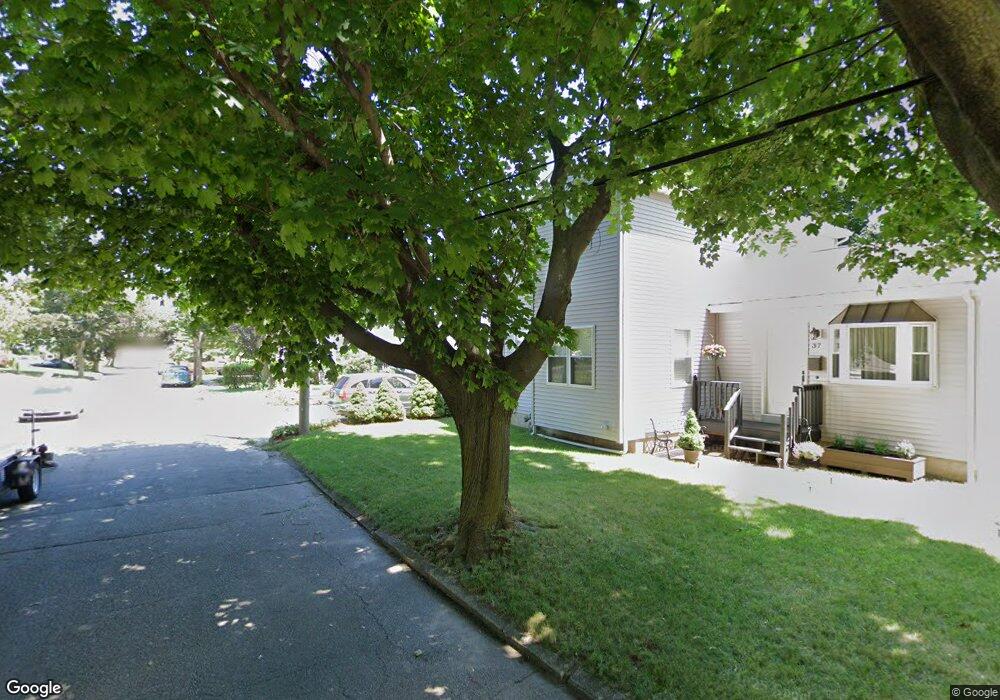
41 Furlong St Cranston, RI 02920
Budlong NeighborhoodEstimated Value: $416,383 - $489,000
3
Beds
2
Baths
1,118
Sq Ft
$410/Sq Ft
Est. Value
About This Home
This home is located at 41 Furlong St, Cranston, RI 02920 and is currently estimated at $458,846, approximately $410 per square foot. 41 Furlong St is a home located in Providence County with nearby schools including Woodridge Elementary School, Western Hills Middle School, and Cranston High School West.
Ownership History
Date
Name
Owned For
Owner Type
Purchase Details
Closed on
May 16, 2013
Sold by
Truong Khanh
Bought by
Truong Khanh and Truong Trung
Current Estimated Value
Purchase Details
Closed on
Jul 22, 2011
Sold by
Sunshine Dev
Bought by
Truong Khanh
Home Financials for this Owner
Home Financials are based on the most recent Mortgage that was taken out on this home.
Original Mortgage
$135,000
Interest Rate
4.81%
Purchase Details
Closed on
Oct 7, 1994
Sold by
Kojian Michael and Kojian Vanouhi
Bought by
Truong Long N
Home Financials for this Owner
Home Financials are based on the most recent Mortgage that was taken out on this home.
Original Mortgage
$70,000
Interest Rate
8.55%
Create a Home Valuation Report for This Property
The Home Valuation Report is an in-depth analysis detailing your home's value as well as a comparison with similar homes in the area
Home Values in the Area
Average Home Value in this Area
Purchase History
| Date | Buyer | Sale Price | Title Company |
|---|---|---|---|
| Truong Khanh | -- | -- | |
| Truong Khanh | $158,000 | -- | |
| Truong Long N | $112,500 | -- |
Source: Public Records
Mortgage History
| Date | Status | Borrower | Loan Amount |
|---|---|---|---|
| Previous Owner | Truong Long N | $135,000 | |
| Previous Owner | Truong Long N | $70,000 |
Source: Public Records
Tax History Compared to Growth
Tax History
| Year | Tax Paid | Tax Assessment Tax Assessment Total Assessment is a certain percentage of the fair market value that is determined by local assessors to be the total taxable value of land and additions on the property. | Land | Improvement |
|---|---|---|---|---|
| 2025 | $4,685 | $337,500 | $102,500 | $235,000 |
| 2024 | $4,593 | $337,500 | $102,500 | $235,000 |
| 2023 | $4,442 | $235,000 | $70,700 | $164,300 |
| 2022 | $4,350 | $235,000 | $70,700 | $164,300 |
| 2021 | $4,230 | $235,000 | $70,700 | $164,300 |
| 2020 | $4,002 | $192,700 | $67,200 | $125,500 |
| 2019 | $4,002 | $192,700 | $67,200 | $125,500 |
| 2018 | $3,910 | $192,700 | $67,200 | $125,500 |
| 2017 | $3,436 | $149,800 | $49,500 | $100,300 |
| 2016 | $3,363 | $149,800 | $49,500 | $100,300 |
| 2015 | $3,363 | $149,800 | $49,500 | $100,300 |
| 2014 | $3,305 | $144,700 | $49,500 | $95,200 |
Source: Public Records
Map
Nearby Homes
- 111 Belgium St
- 92 Rhode Island St
- 46 Roslyn Ave
- 55 Columbus Blvd
- 99 Salem Ave
- 14 New Hampshire St
- 69 W View Ave
- 1574 Cranston St
- 70 Florida Ave
- 9 Southern St
- 54 Randall St
- 80 Phenix Ave
- 174 Gansett Ave
- 86 Sherwood St
- 210 Hyde St
- 63 Packard St
- 0 Rutland St
- 80 Packard St
- 7 Cleveland Ave
- 34 Aldrich Ave