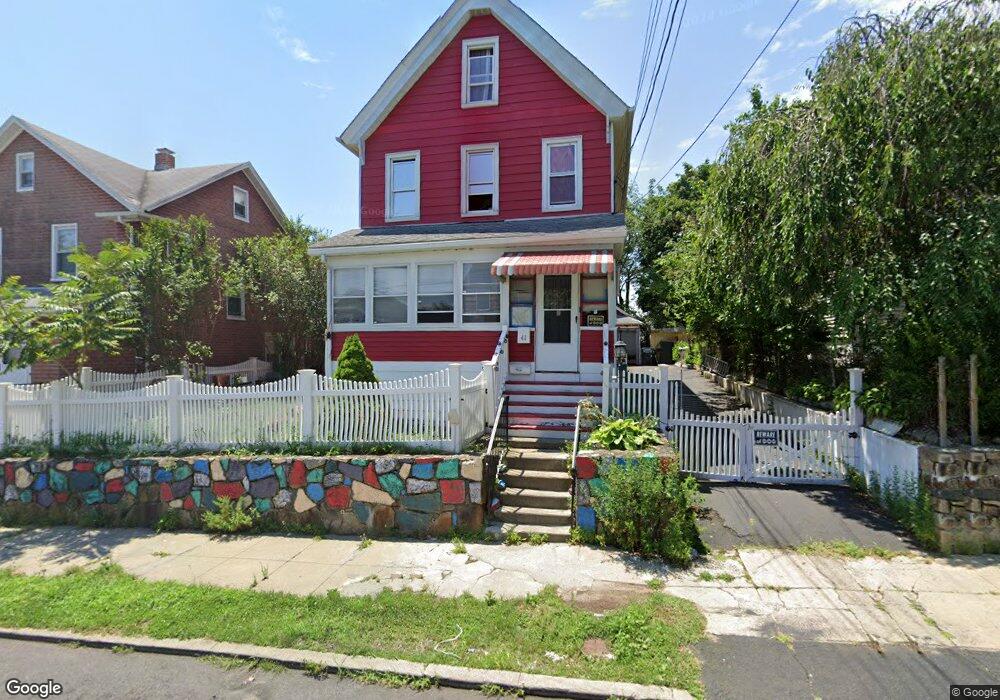
41 Hillside Ave Bridgeport, CT 06604
Brooklawn-Saint Vincent NeighborhoodEstimated Value: $362,000 - $465,000
3
Beds
3
Baths
1,490
Sq Ft
$271/Sq Ft
Est. Value
About This Home
This home is located at 41 Hillside Ave, Bridgeport, CT 06604 and is currently estimated at $403,988, approximately $271 per square foot. 41 Hillside Ave is a home located in Fairfield County with nearby schools including Blackham School, Central High School, and Assumption Catholic School.
Ownership History
Date
Name
Owned For
Owner Type
Purchase Details
Closed on
Jul 6, 2010
Sold by
Wcg 12 Llc
Bought by
Wcg 8 Llc
Current Estimated Value
Home Financials for this Owner
Home Financials are based on the most recent Mortgage that was taken out on this home.
Original Mortgage
$104,000
Outstanding Balance
$92,067
Interest Rate
14%
Mortgage Type
Purchase Money Mortgage
Estimated Equity
$311,921
Purchase Details
Closed on
Feb 9, 2010
Sold by
Ortiz Pablo
Bought by
Hsbc Mortgage Svcs
Purchase Details
Closed on
Aug 10, 2005
Sold by
Faustine 3Rd Frank and Faustine Angela
Bought by
Ortiz Pablo
Purchase Details
Closed on
Jun 25, 2002
Sold by
Morino Philip
Bought by
Faustine Frank L and Faustine Angela R
Create a Home Valuation Report for This Property
The Home Valuation Report is an in-depth analysis detailing your home's value as well as a comparison with similar homes in the area
Home Values in the Area
Average Home Value in this Area
Purchase History
| Date | Buyer | Sale Price | Title Company |
|---|---|---|---|
| Wcg 8 Llc | -- | -- | |
| Wcg 12 Llc Carter Grp | $102,750 | -- | |
| Wcg 12 Llc Carter Grp | $102,750 | -- | |
| Hsbc Mortgage Svcs | -- | -- | |
| Hsbc Mortgage Svcs | -- | -- | |
| Ortiz Pablo | $220,000 | -- | |
| Ortiz Pablo | $220,000 | -- | |
| Faustine Frank L | $135,000 | -- | |
| Faustine Frank L | $135,000 | -- |
Source: Public Records
Mortgage History
| Date | Status | Borrower | Loan Amount |
|---|---|---|---|
| Open | Faustine Frank L | $104,000 | |
| Closed | Faustine Frank L | $104,000 |
Source: Public Records
Tax History
| Year | Tax Paid | Tax Assessment Tax Assessment Total Assessment is a certain percentage of the fair market value that is determined by local assessors to be the total taxable value of land and additions on the property. | Land | Improvement |
|---|---|---|---|---|
| 2025 | $6,305 | $145,110 | $76,440 | $68,670 |
| 2024 | $6,305 | $145,110 | $76,440 | $68,670 |
| 2023 | $6,305 | $145,110 | $76,440 | $68,670 |
| 2022 | $6,305 | $145,110 | $76,440 | $68,670 |
| 2021 | $6,305 | $145,110 | $76,440 | $68,670 |
| 2020 | $5,883 | $108,970 | $46,320 | $62,650 |
| 2019 | $5,883 | $108,970 | $46,320 | $62,650 |
| 2018 | $5,925 | $108,970 | $46,320 | $62,650 |
| 2017 | $5,925 | $108,970 | $46,320 | $62,650 |
| 2016 | $5,925 | $108,970 | $46,320 | $62,650 |
| 2015 | $5,619 | $133,140 | $51,370 | $81,770 |
| 2014 | $5,619 | $133,140 | $51,370 | $81,770 |
Source: Public Records
Map
Nearby Homes
- 1406 Wood Ave
- 1440 Wood Ave
- 1515 Capitol Ave Unit 1517
- 35 Querida St
- 660 W Jackson Ave
- 523 W Jackson Ave
- 61 Astoria Ave
- 2625 Park Ave Unit 9R
- 2625 Park Ave Unit 4F
- 2675 Park Ave Unit 26
- 493 W Taft Ave
- 366 Brooklawn Ave
- 85-89 Alexander Dr
- 125-127 Alexander Dr
- 84 Algonquin Rd
- 2078 Park Ave Unit 2082
- 91 Algonquin Rd
- 1285 Norman St
- 25 Myron Ave
- 11 Myron Ave
- 45 Hillside Ave
- 39 Hillside Ave
- 1348 Wood Ave
- 49 Hillside Ave Unit 51
- 1560 Capitol Ave
- 1590 Capitol Ave
- 61 Hillside Ave Unit 63
- 1372 Wood Ave
- 1568 Capitol Ave
- 40 Hillside Ave
- 52 Hillside Ave Unit 54
- 44 Hillside Ave
- 38 Hillside Ave
- 1558 Capitol Ave
- 54 Hillside Ave
- 71 Hillside Ave
- 71 Hillside Ave Unit 2
- 71 Hillside Ave Unit 3
- 64 Hillside Ave
- 1392 Wood Ave
Your Personal Tour Guide
Ask me questions while you tour the home.