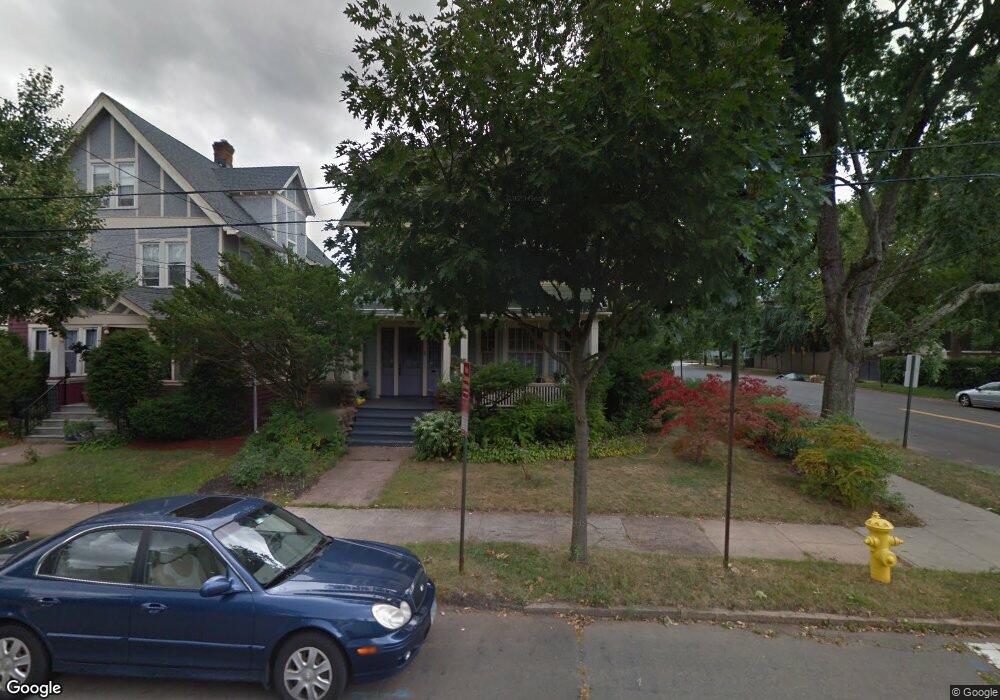
41 Hobart St New Haven, CT 06511
Edgewood NeighborhoodEstimated Value: $458,332 - $493,000
4
Beds
3
Baths
2,576
Sq Ft
$183/Sq Ft
Est. Value
About This Home
This home is located at 41 Hobart St, New Haven, CT 06511 and is currently estimated at $471,083, approximately $182 per square foot. 41 Hobart St is a home located in New Haven County with nearby schools including Hopkins School and Yeshiva Gedolah Rabbinical Inst.
Ownership History
Date
Name
Owned For
Owner Type
Purchase Details
Closed on
May 30, 1997
Sold by
Duda Turan and Duda Linda V
Bought by
Demarino Margaret A
Current Estimated Value
Home Financials for this Owner
Home Financials are based on the most recent Mortgage that was taken out on this home.
Original Mortgage
$100,000
Outstanding Balance
$11,114
Interest Rate
5.3%
Mortgage Type
Purchase Money Mortgage
Estimated Equity
$459,969
Create a Home Valuation Report for This Property
The Home Valuation Report is an in-depth analysis detailing your home's value as well as a comparison with similar homes in the area
Home Values in the Area
Average Home Value in this Area
Purchase History
| Date | Buyer | Sale Price | Title Company |
|---|---|---|---|
| Demarino Margaret A | $125,000 | -- |
Source: Public Records
Mortgage History
| Date | Status | Borrower | Loan Amount |
|---|---|---|---|
| Open | Demarino Margaret A | $100,000 | |
| Previous Owner | Demarino Margaret A | $90,000 |
Source: Public Records
Tax History Compared to Growth
Tax History
| Year | Tax Paid | Tax Assessment Tax Assessment Total Assessment is a certain percentage of the fair market value that is determined by local assessors to be the total taxable value of land and additions on the property. | Land | Improvement |
|---|---|---|---|---|
| 2025 | $7,273 | $184,590 | $48,370 | $136,220 |
| 2024 | $7,107 | $184,590 | $48,370 | $136,220 |
| 2023 | $6,867 | $184,590 | $48,370 | $136,220 |
| 2022 | $6,631 | $166,810 | $48,370 | $118,440 |
| 2021 | $4,948 | $112,770 | $41,650 | $71,120 |
| 2020 | $4,948 | $112,770 | $41,650 | $71,120 |
| 2019 | $4,552 | $105,910 | $41,650 | $64,260 |
| 2018 | $4,552 | $105,910 | $41,650 | $64,260 |
| 2017 | $4,097 | $105,910 | $41,650 | $64,260 |
| 2016 | $3,609 | $86,870 | $32,760 | $54,110 |
| 2015 | $3,609 | $86,870 | $32,760 | $54,110 |
| 2014 | $3,609 | $86,870 | $32,760 | $54,110 |
Source: Public Records
Map
Nearby Homes