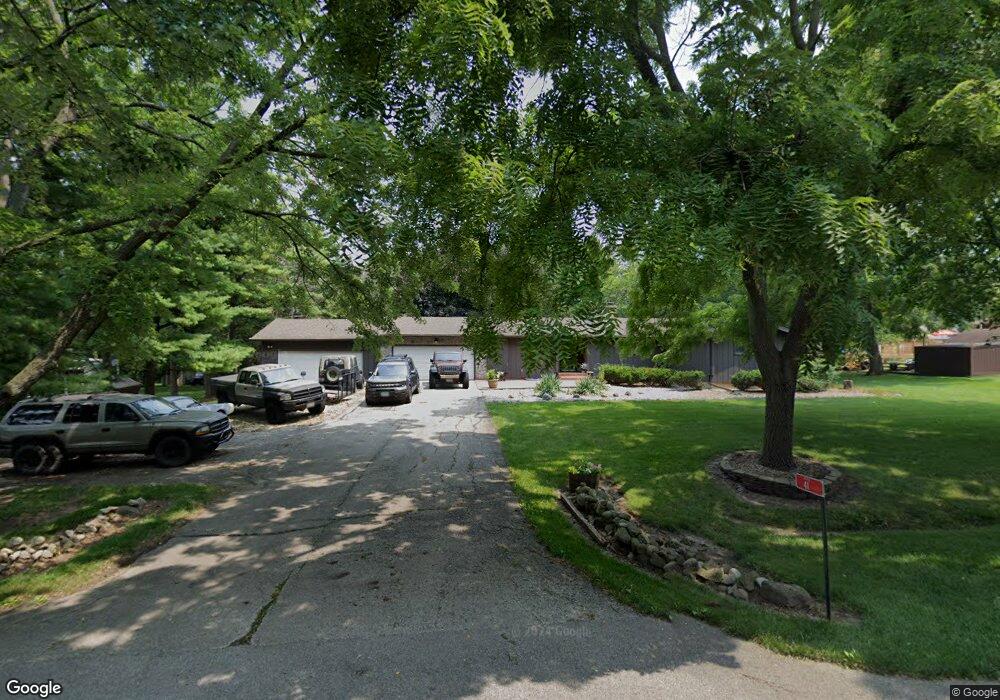
41 Leisure Ln Oswego, IL 60543
Estimated Value: $378,000 - $392,000
4
Beds
2
Baths
1,582
Sq Ft
$244/Sq Ft
Est. Value
About This Home
This home is located at 41 Leisure Ln, Oswego, IL 60543 and is currently estimated at $385,228, approximately $243 per square foot. 41 Leisure Ln is a home located in Kendall County with nearby schools including Grande Park Elementary School, Murphy Junior High School, and Oswego East High School.
Ownership History
Date
Name
Owned For
Owner Type
Purchase Details
Closed on
Feb 18, 2015
Sold by
Frahm Paul D and Frahm Carrie
Bought by
Frahm Paul D
Current Estimated Value
Purchase Details
Closed on
May 25, 2002
Sold by
Klingenberg Eric H and Klingenberg Milissa Ann
Bought by
Frahm Paul D and Frahm Carrie
Home Financials for this Owner
Home Financials are based on the most recent Mortgage that was taken out on this home.
Original Mortgage
$188,200
Interest Rate
5%
Purchase Details
Closed on
Nov 22, 2000
Sold by
Legner Kenneth L and Legner Barbara E
Bought by
Klingenberg Eric H and Klingenberg Milissa Ann
Home Financials for this Owner
Home Financials are based on the most recent Mortgage that was taken out on this home.
Original Mortgage
$174,400
Interest Rate
7.8%
Purchase Details
Closed on
Jun 1, 1994
Bought by
Legner Kenneth L
Purchase Details
Closed on
Jun 1, 1989
Create a Home Valuation Report for This Property
The Home Valuation Report is an in-depth analysis detailing your home's value as well as a comparison with similar homes in the area
Home Values in the Area
Average Home Value in this Area
Purchase History
| Date | Buyer | Sale Price | Title Company |
|---|---|---|---|
| Frahm Paul D | -- | None Available | |
| Frahm Paul D | $235,500 | Chicago Title Insurance Co | |
| Klingenberg Eric H | $218,000 | Ticor Title Insurance Compan | |
| Legner Kenneth L | $168,100 | -- | |
| -- | $143,500 | -- |
Source: Public Records
Mortgage History
| Date | Status | Borrower | Loan Amount |
|---|---|---|---|
| Previous Owner | Frahm Paul D | $188,200 | |
| Previous Owner | Klingenberg Eric H | $174,400 | |
| Closed | Legner Kenneth L | -- | |
| Closed | Klingenberg Eric H | $32,700 |
Source: Public Records
Tax History Compared to Growth
Tax History
| Year | Tax Paid | Tax Assessment Tax Assessment Total Assessment is a certain percentage of the fair market value that is determined by local assessors to be the total taxable value of land and additions on the property. | Land | Improvement |
|---|---|---|---|---|
| 2024 | $8,168 | $109,188 | $26,509 | $82,679 |
| 2023 | $7,643 | $98,368 | $23,882 | $74,486 |
| 2022 | $7,643 | $91,933 | $22,320 | $69,613 |
| 2021 | $7,755 | $90,130 | $21,882 | $68,248 |
| 2020 | $7,668 | $88,363 | $21,453 | $66,910 |
| 2019 | $7,607 | $86,415 | $21,453 | $64,962 |
| 2018 | $7,669 | $84,472 | $20,971 | $63,501 |
| 2017 | $7,606 | $81,223 | $20,164 | $61,059 |
| 2016 | $7,274 | $76,989 | $19,113 | $57,876 |
| 2015 | $7,020 | $71,286 | $17,697 | $53,589 |
| 2014 | -- | $69,210 | $17,182 | $52,028 |
| 2013 | -- | $69,910 | $17,356 | $52,554 |
Source: Public Records
Map
Nearby Homes
- 4 Amy Dr Unit 3
- 382 Hemlock Ln
- 1481B Collins Rd
- 001 Woolley Rd
- 230 Liszka Ln
- 733 Juniper St
- 2249 Riesling Rd
- 2255 Riesling Rd
- 2253 Riesling Rd
- 309 Monica Ln
- 2509 Semillon St
- 444 Hathaway Ln
- 2319 Hirsch Dr
- 2311 Hirsch Rd
- 2244 Barbera Dr
- 2307 Hirsch Dr
- 2447 Scribe St
- 2261 Riesling Rd
- 2486 Semillon St
- 2492 Semillon St