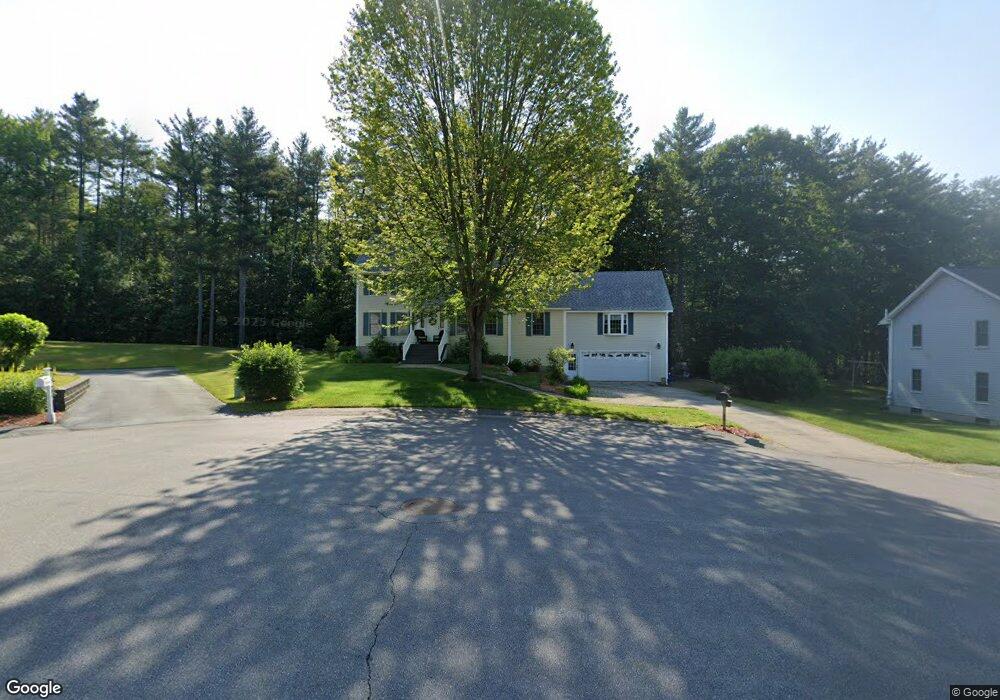
41 Level St Merrimack, NH 03054
Estimated Value: $688,000 - $825,000
3
Beds
3
Baths
3,343
Sq Ft
$222/Sq Ft
Est. Value
About This Home
This home is located at 41 Level St, Merrimack, NH 03054 and is currently estimated at $741,360, approximately $221 per square foot. 41 Level St is a home located in Hillsborough County with nearby schools including Reeds Ferry School, James Mastricola Upper Elementary School, and Merrimack Middle School.
Ownership History
Date
Name
Owned For
Owner Type
Purchase Details
Closed on
Nov 13, 2024
Sold by
Perez Sergio R and Lee-Perez Cynthia A
Bought by
S R & C A Lee-Perez Ret and Perez
Current Estimated Value
Purchase Details
Closed on
May 3, 1993
Bought by
Perez Sergio and Perez Cynthia A
Create a Home Valuation Report for This Property
The Home Valuation Report is an in-depth analysis detailing your home's value as well as a comparison with similar homes in the area
Home Values in the Area
Average Home Value in this Area
Purchase History
| Date | Buyer | Sale Price | Title Company |
|---|---|---|---|
| S R & C A Lee-Perez Ret | -- | None Available | |
| S R & C A Lee-Perez Ret | -- | None Available | |
| Perez Sergio | $142,500 | -- |
Source: Public Records
Mortgage History
| Date | Status | Borrower | Loan Amount |
|---|---|---|---|
| Previous Owner | Perez Sergio | $206,000 | |
| Previous Owner | Perez Sergio | $235,000 |
Source: Public Records
Tax History Compared to Growth
Tax History
| Year | Tax Paid | Tax Assessment Tax Assessment Total Assessment is a certain percentage of the fair market value that is determined by local assessors to be the total taxable value of land and additions on the property. | Land | Improvement |
|---|---|---|---|---|
| 2024 | $10,657 | $515,100 | $174,800 | $340,300 |
| 2023 | $10,019 | $515,100 | $174,800 | $340,300 |
| 2022 | $8,952 | $515,100 | $174,800 | $340,300 |
| 2021 | $8,844 | $515,100 | $174,800 | $340,300 |
| 2020 | $8,652 | $359,600 | $137,400 | $222,200 |
| 2019 | $8,677 | $359,600 | $137,400 | $222,200 |
| 2018 | $8,674 | $359,600 | $137,400 | $222,200 |
| 2017 | $7,967 | $340,900 | $137,400 | $203,500 |
| 2016 | $7,769 | $340,900 | $137,400 | $203,500 |
| 2015 | $7,401 | $299,400 | $120,300 | $179,100 |
| 2014 | $7,213 | $299,400 | $120,300 | $179,100 |
| 2013 | $7,159 | $299,400 | $120,300 | $179,100 |
Source: Public Records
Map
Nearby Homes
- 5 Barbie Ct
- 29 Bedford Rd
- 18 Horizon Dr
- 16 Summit Rd
- 56 Greenfield Pkwy
- 22 Kimberly Dr
- 38 Mallard Point
- 19 Vista Way
- 8 Donovan Ct
- 1 Pleasant St
- 10 Barrington Dr
- 40 Seton Dr
- 10 Kingston Ct Unit 10
- 22 Essex Green Ct
- 11 Essex Green Ct
- 12 Clinton Ct
- 22 Clay St
- 9 Mustang Dr Unit C
- 9 Mustang Dr Unit B
- 7 Mustang Dr Unit C