41 Lilly St Florence, MA 01062
Florence NeighborhoodEstimated Value: $539,000 - $592,000
5
Beds
3
Baths
2,250
Sq Ft
$254/Sq Ft
Est. Value
About This Home
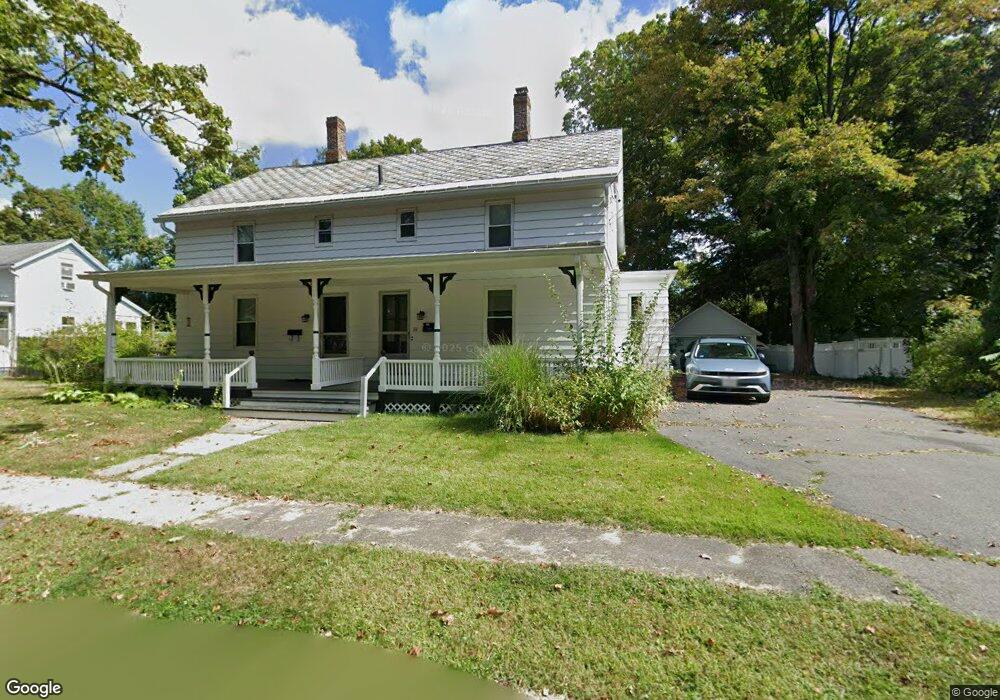
This home is located at 41 Lilly St, Florence, MA 01062 and is currently estimated at $571,621, approximately $254 per square foot. 41 Lilly St is a home located in Hampshire County with nearby schools including Northampton High School, The Montessori School of Northampton, and Lander Grinspoon Academy.
Ownership History
Date
Name
Owned For
Owner Type
Purchase Details
Closed on
Nov 30, 2001
Sold by
Howes Sylvia J and Sparling Doreen B
Bought by
Ganssle Grace
Current Estimated Value
Home Financials for this Owner
Home Financials are based on the most recent Mortgage that was taken out on this home.
Original Mortgage
$178,500
Interest Rate
6.66%
Mortgage Type
Purchase Money Mortgage
Purchase Details
Closed on
Jan 30, 1998
Sold by
Bourque Helen M
Bought by
Howes Sylvia J and Sparling Doreen B
Home Financials for this Owner
Home Financials are based on the most recent Mortgage that was taken out on this home.
Original Mortgage
$123,300
Interest Rate
7.02%
Mortgage Type
Purchase Money Mortgage
Purchase Details
Closed on
Jul 31, 1997
Sold by
Brown Ruth O
Bought by
Brown Sara and Forrestall James E
Create a Home Valuation Report for This Property
The Home Valuation Report is an in-depth analysis detailing your home's value as well as a comparison with similar homes in the area
Home Values in the Area
Average Home Value in this Area
Purchase History
| Date | Buyer | Sale Price | Title Company |
|---|---|---|---|
| Ganssle Grace | $210,000 | -- | |
| Howes Sylvia J | $137,000 | -- | |
| Brown Sara | $118,000 | -- |
Source: Public Records
Mortgage History
| Date | Status | Borrower | Loan Amount |
|---|---|---|---|
| Open | Brown Sara | $210,000 | |
| Closed | Brown Sara | $178,500 | |
| Previous Owner | Brown Sara | $123,300 |
Source: Public Records
Tax History Compared to Growth
Tax History
| Year | Tax Paid | Tax Assessment Tax Assessment Total Assessment is a certain percentage of the fair market value that is determined by local assessors to be the total taxable value of land and additions on the property. | Land | Improvement |
|---|---|---|---|---|
| 2025 | $7,283 | $522,800 | $170,600 | $352,200 |
| 2024 | $6,167 | $406,000 | $148,900 | $257,100 |
| 2023 | $5,763 | $363,800 | $135,300 | $228,500 |
| 2022 | $6,052 | $338,300 | $126,500 | $211,800 |
| 2021 | $5,499 | $316,600 | $120,500 | $196,100 |
| 2020 | $5,319 | $316,600 | $120,500 | $196,100 |
| 2019 | $4,693 | $270,200 | $120,500 | $149,700 |
| 2018 | $4,372 | $256,600 | $120,500 | $136,100 |
| 2017 | $4,283 | $256,600 | $120,500 | $136,100 |
| 2016 | $4,147 | $256,600 | $120,500 | $136,100 |
| 2015 | $4,422 | $279,900 | $130,500 | $149,400 |
| 2014 | $4,308 | $279,900 | $130,500 | $149,400 |
Source: Public Records
Map
Nearby Homes
- 84 N Main St
- 67 Park St Unit A
- 67 Park St Unit B
- 67 Park St Unit D
- 76 Maple St
- 225 Nonotuck St Unit C
- 152 S Main St Unit 4
- 37 Landy Ave
- 96 Rick Dr
- 0 Terrace Ln
- 11 Norwood Ave
- 325 Riverside Dr
- 321 Riverside Dr
- 63 Riverside Dr
- 39 Matthew Dr
- 107 Front St
- 76 Cooke Ave
- 138 Overlook Dr
- 139 Water St
- 61 Woodlawn Ave